Mark Hulbert recently penned a very good article discussing the “Eight Best Predictors Of The Stock Market,” to wit:
“The stock market’s return over the next decade is likely to be well below historical norms.
That is the unanimous conclusion of eight stock-market indicators with what I consider the most impressive track records over the past six decades. The only real difference between them is the extent of their bearishness.
To illustrate the bearish story told by each of these indicators, consider the projected 10-year returns to which these indicators’ current levels translate. The most bearish projection of any of them was that the S&P 500 would produce a 10-year total return of 3.9 percentage points annualized below inflation. The most bullish was 3.6 points above inflation.
The most accurate of the indicators I studied was created by the anonymous author of the blog Philosophical Economics. It is now as bearish as it was right before the 2008 financial crisis, projecting an inflation-adjusted S&P 500 total return of just 0.8 percentage point above inflation. Ten-year Treasuries can promise you that return with far less risk.”
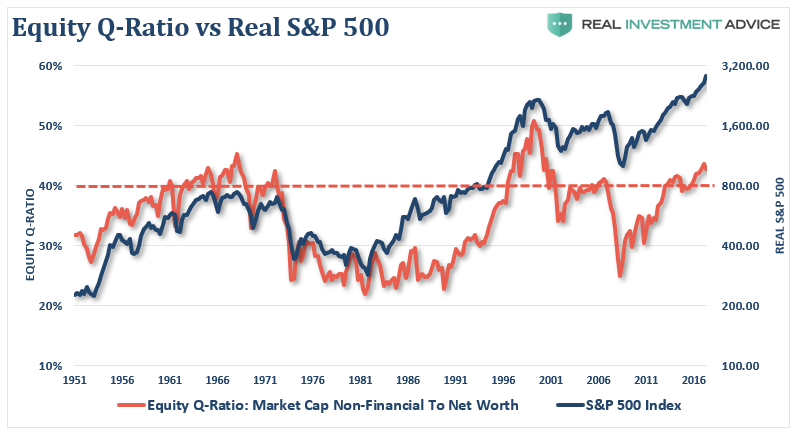
Here is one of the eight indicators, a chart of Livermore’s Equity-Q Ratio which is essentially household’s equity allocation to net worth:
The other seven are as follows:
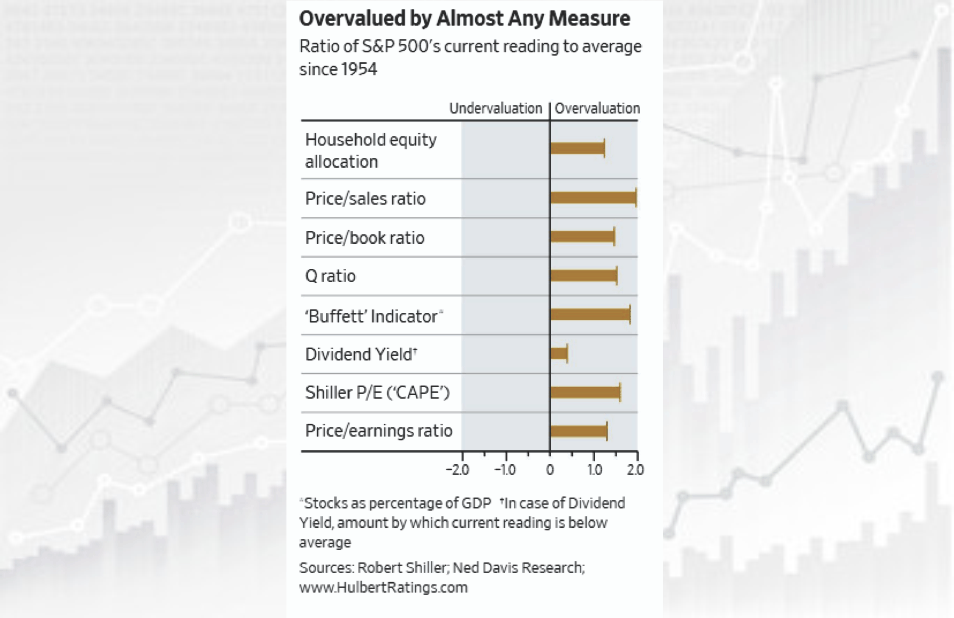
As Hulbert states:
“According to various tests of statistical significance, each of these indicators’ track records is significant at the 95% confidence level that statisticians often use when assessing whether a pattern is genuine.
However, the differences between the R-squared of the top four or five indicators I studied probably aren’t statistically significant, I was told by Prof. Shiller. That means you’re overreaching if you argue that you should pay more attention to, say, the average household equity allocation than the price/sales ratio.”
As I discussed in “Valuation Measures and Forward Returns:”
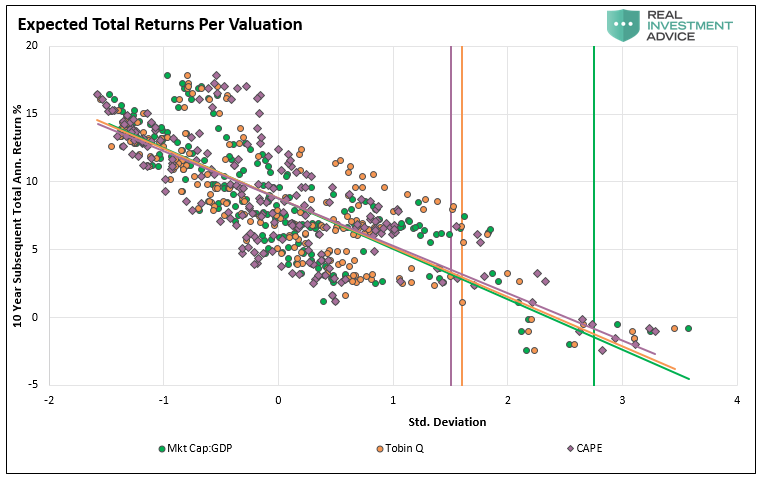
“No matter, how many valuation measures I use, the message remains the same. From current valuation levels, the expected rate of return for investors over the next decade will be low.”
This is shown in the chart below, courtesy of Michael Lebowitz, which shows the standard deviation from the long-term mean of the “Buffett Indicator,” or market capitalization to GDP, Tobin’s Q, and Shiller’s CAPE compared to forward real total returns over the next 10-years. Michael will go into more detail on this graph and what it means for asset allocation in the coming weeks.
The Problem With Valuation Measures
First, let me explain what “low forward returns” does and does not mean.
- It does NOT mean the stock market will have annual rates of return of sub-3% each year over the next 10-years.
- It DOES mean the stock market will have stellar gains in some years, a big crash somewhere in between, or several smaller ones, and the average return over the decade will be low.
This is shown in the table and chart below which compares a 7% annual return (as often promised) to a series of positive returns with a loss, or two, along the way. (Note: the annual average return without the crashes is 7% annually also.)
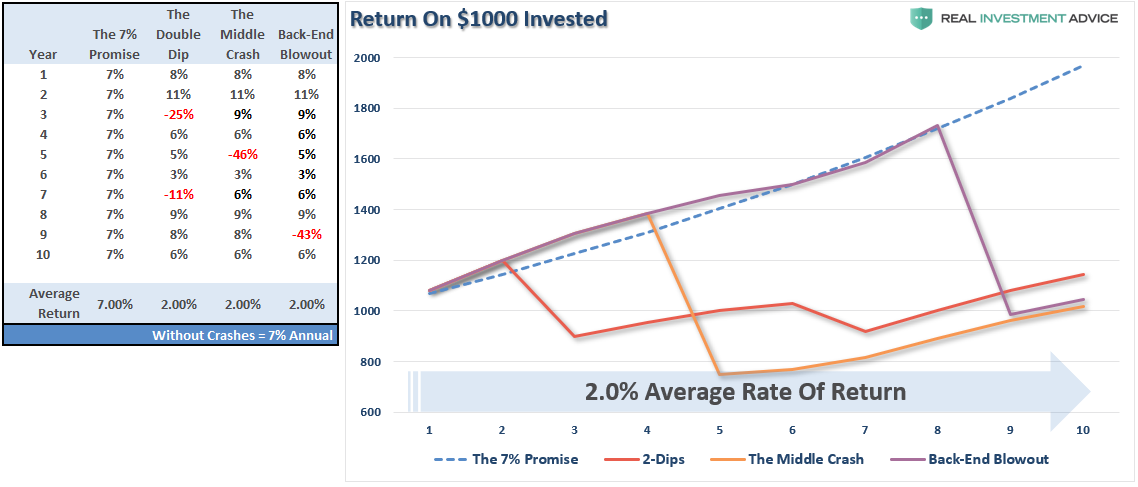
From current valuation levels, two-percent forward rates of return are a real possibility. As shown, all it takes is a correction, or crash, along the way to make it a reality.
The problem with using valuation measures, as Mark Hulbert discusses, is that there can be a long period between a valuation warning and a market correction. This was a point made by Eddy Elfenbein from Crossing Wall Street:
“For the record, I’m a bit skeptical of these metrics. Sure, they’re interesting to look at, but I try to place them within a larger framework.
It’s not terribly hard to find a measure that shows an overvalued market and then use a long time period to show the market has performed below average during your defined overvalued period. That’s easy.
The difficulty is in timing the market.
Even if you know the market is overpriced, that doesn’t tell you much about how to invest today.”
He is correct.
So, if valuation measures tell you a problem is coming, but don’t tell you what to do, then Wall Street’s answer is simply to “do nothing.” After all, you will eventually recover the losses….right?
However, getting back to even and actually reaching your financial goals are two entirely different things as we discussed recently in “Crashes Matter.”
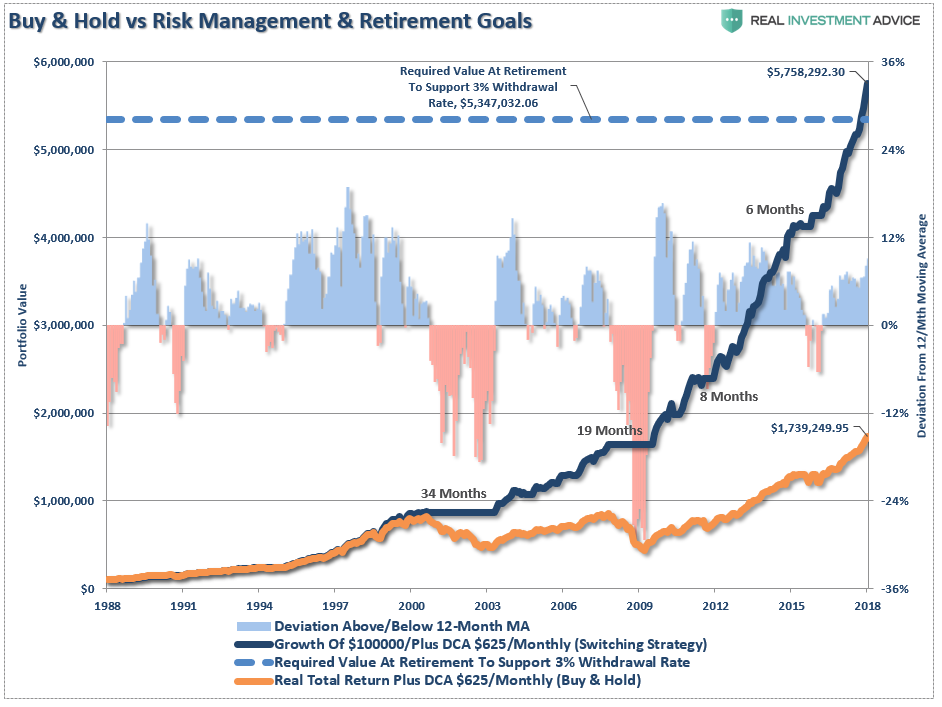
There is an important point to be made here. The old axioms of “time in the market” and the “power of compounding” are true, but they are only true as long as the principal value is not destroyed along the way. The destruction of the principal destroys both “time” and “the magic of compounding.”
Or more simply put – “getting back to even” is not the same as “growing.”
Is there a solution?
Linking Fundamentals To Technicals
I have often discussed an important point in reference to our portfolio management process:
“Fundamentals tell us ‘what’ to buy or sell, technicals tell us the ‘when.'”
Fundamentals are a long-term view on an investment. From these fundamental underpinnings, we can assess and assign a “valuation” to an investment to determine whether it is over or undervalued. Of course, in the famous words of Warren Buffett:
“Price is what you pay. Value is what you get.”
In the financial markets, however, psychology can drive prices farther, and further, than logic would dictate. But such is the nature of every stage of a bull market cycle where the “momentum” chase, or rather the physical manifestation of “greed,” comes to life. This is also the point where statements such as “this time is different,” “fundamentals have changed,” or a variety of other excuses, are used to justify rampant speculation in the markets.
Despite the detachment from valuations, as markets continue to escalate higher, the fundamental warnings are readily dismissed in exchange for any data point which supports the bullish bias.
Eventually, it has always come to a rather ignominious ending.
But why does it have to be one or the other?
Currently, the Equity Q-ratio, as graphed above, is at levels that have historically denoted very poor future returns for investors. In other words, if you went to cash today, it is quite likely that over the next 10-years the value of your portfolio would be roughly the same.
However, before that “mean reverting event” occurs the market will most likely continue to advance. So, there you are, sitting on the sidelines waiting for the crash.
“Damn it, I am missing out. I should have just stayed in.”
The feeling of “missing out” can be overpowering as the momentum driven market rises. Like gravity, the more the market rises, the greater the pull to “jump back in” becomes. Eventually, and typically near the peak of the market cycle, investors capitulate to the pressure.
Understanding that price is a reflection of short-term market psychology, the trend of prices can give us some clue as to the direction of the market. As the old saying goes:
“The trend is your friend, until it isn’t.”
While the Equity Q-ratio implies low forward returns, technical analysis can give us the “timing” as to when “psychology” has begun to align with the underlying “fundamentals.”.
In the chart below we have added vertical “gold” bars which denote when negative price changes warrant reducing equity risk in portfolios. (The chart uses quarterly data and triggers a signal when the 6-month moving average crosses the 2-year moving average.)
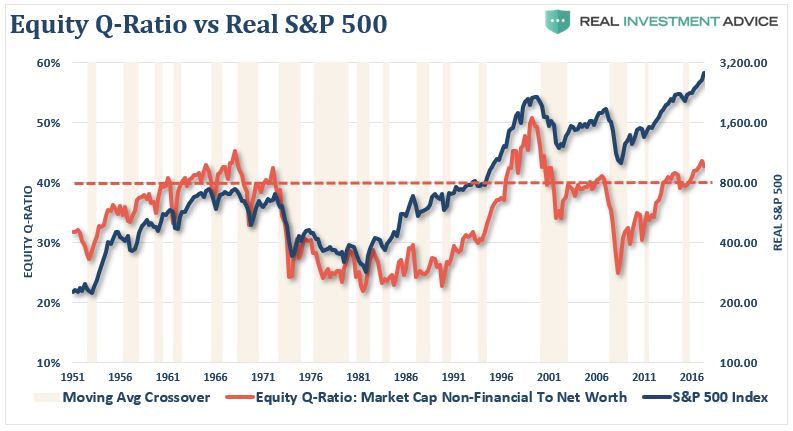
Since 1951, this “equity reduction” signal has only occurred 17-times. Yes, since these are long-term quarterly moving averages, investors would not have necessarily “top ticked” and sold at the peak, nor would they have bought the absolute bottoms. However, they would have succeeded in avoiding much of the capital destruction of the declines and garnered most of the gains.
The last time the Equity-Q ratio was above 40% was during the late 2015/2016 correction and the technical signal warned that a reduction of risk was warranted.
The mistake most investors make is not getting “back in” when the signal reverses. The value of technical analysis is providing a glimpse into the “stampede of the herd.” When the psychology is overwhelmingly bullish, investors should be primarily allocated towards equity risk. When its not, equity risk should be greatly reduced.
Unfortunately, investors tend to not heed signals at market peaks because the belief is that stocks can only go up from here. At bottoms, investors fail to “buy” as the overriding belief is the market is heading towards zero.
In a recent post, It’s Not Too Early To Be Late, Michael Lebowitz showed the historical pain investors suffered by exiting a raging bull market too early. However, he also showed that those who exited markets three years prior to peaks, when valuations were similar to today’s, profited in the long-run.
While technical analysis can provide timely and useful information for investors, it is our “behavioral issues” which lead to underperformance over time.
Currently, with the Equity Q-ratio pushing the 3rd highest level in history, investors should be very concerned about forward returns. However, with the technical trends currently “bullish,” equity exposure should remain near target levels for now.
That is until the trend changes.
When the next long-term technical “sell signal” is registered, investors should consider heeding the warnings.
Yes, even with this, you may still “leave the party” a little early.
But such is always better than getting trapped in rush for the exits when the cops arrive.
Lance Roberts is a chief portfolio strategist and economist for Clarity Financial. He is also the host of "Street Talk with Lance Roberts," chief editor of "The X-Factor" Investment Newsletter and the Streettalklive daily blog. Follow Lance on Facebook, Twitter and LinkedIn.
© 2024 Newsmax Finance. All rights reserved.