Last week, while I was on vacation, I penned a report prior to the release of the second quarter GDP report in which I noted the following:
“Tomorrow, the US Department of Commerce will report its advance estimate of 2Q GDP which will be the long-awaited evidence that “Trumponomics” is working. The current estimates for the initial print run the gamut from 3.9% to over 5% annualized growth. Regardless of the actual number, the White House spokesman will be quick to take credit for success in turning America’s economy around.
But is that really the case? First, there are several things to remember about the initial print on economic growth.
- The initial estimate is based on the collection of estimates from Wall Street economists. With no real data in just yet, the initial estimate just a “guess.”
- The number is annualized. So, a growth of 1% in the economy is reported as 4%. However, as we know from the first quarter, quarterly growth can vary widely in a given year.
- Lastly, a one-quarter surge in economic growth doesn’t make much difference in the long-term trajectory of economic growth, or in this case, ongoing weakness. The chart below shows the change in economic growth by decade.”
As noted, the 1% growth rate in the second quarter was multiplied by 4-quarters to reach the proclaimed 4.1% growth rate. However, there is little evidence to support the notion that such mathematical projections have much validity. The chart below shows inflation-adjusted GDP growth on a quarterly basis as compared to economist expectations of sustained growth over the next 3-quarters. Not surprisingly, economic growth tends to vary widely from those expectations. More importantly, spikes in economic growth tend to lead lower rates over subsequent quarters.
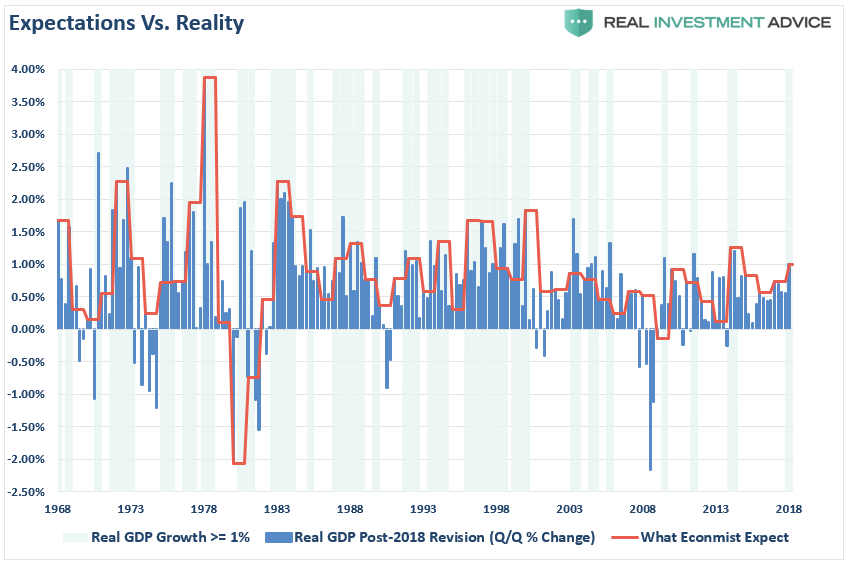
As we now know, the actual first estimate aligned with the 4% assumption made last week along with the expectation the current Administration, and media pundits, would go “all giddy.”
However, from a portfolio management standpoint, I am more interested in the “devil in the details” as economic growth is key to sustained growth in corporate revenue and profits. From an investment standpoint, it is more important to understand the sustainability of economic growth when projecting forward returns and modeling asset allocations around those assumptions. There are also several other important considerations with respect to the most recent GDP report.
Economy Gets A $1 Trillion Boost
With the release of the Q2 GDP report, and not covered by any of the mainstream media, was an adjustment the economic data going all the way back to 1929.
As noted by Wolf Richter:
“What the Bureau of Economic Analysis released Friday as part of its GDP report was a huge pile of revisions and adjustments going back years. It included an adjustment to the tune of nearly $1 trillion in ‘real’ GDP. And it lowered further its already low measure of inflation.
Comprehensive updates of the National Income and Product Accounts (NIPAs), which are carried out about every five years, are an important part of BEA’s regular process for improving and modernizing its accounts to keep pace with the ever-changing U.S. economy. Updates incorporate newly available and more comprehensive source data, as well as improved estimation methodologies. The timespan for this year’s comprehensive update is 1929 through the first quarter 2018.“
Where did a bulk of the change come from? A change in the calculation of “real” GDP from using 2009 dollars to 2012 dollars which boosted growth strictly from a lower rate of inflation. As noted by the BEA:
“For 2012-2017, the average rate of change in the prices paid by U.S. residents, as measured by the gross domestic purchasers’ price index, was 1.2 percent, 0.1 percentage point lower than in the previously published estimates.”
Of course, when you ask the average household about “real inflation,” in terms of healthcare costs, insurance, food, energy, etc., they are likely to give you quite an earful that the cost of living is substantially higher than 1.2%. Nonetheless, the chart below shows “real” GDP both pre- and post-2018 revisions.
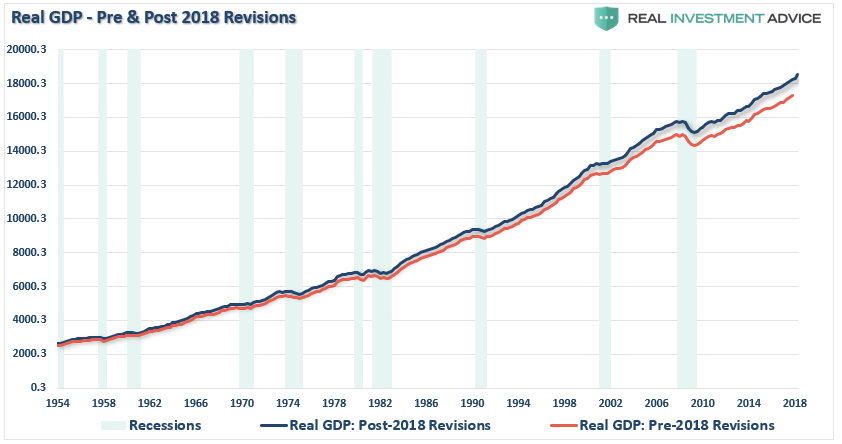
Importantly, the entire revision is almost entirely due to a change in the inflation rate. On a nominal basis, there was virtually no real change at all. In other words, stronger economic growth came from a mathematical adjustment rather than increases in actual economic activity.
Population Matters
When the media reports on economic growth, employment gains, retail sales, personal consumption expenditures or a variety of other measures, there is little consideration given to increases in the population.
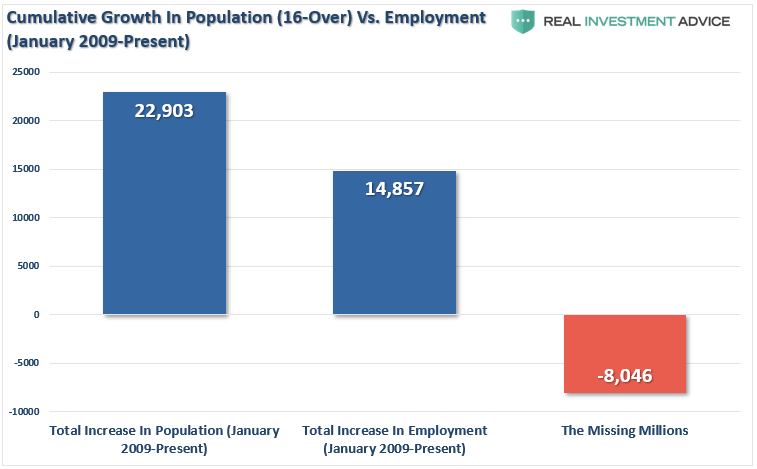
With respect to economic growth, population increases matter. In an economy that is 70% driven by personal consumption expenditures, adding more consumers to the population will positively impact economic growth. The increase in demand from additional consumers will lead to an increase in retail sales, employment gains, etc. However, as we showed previously, while there is much “hype” about employment gains in the economy, the reality is that employment has failed to keep pace with population growth.
The chart below shows the difference between “real” GDP growth and “real” GDP growth per capita.
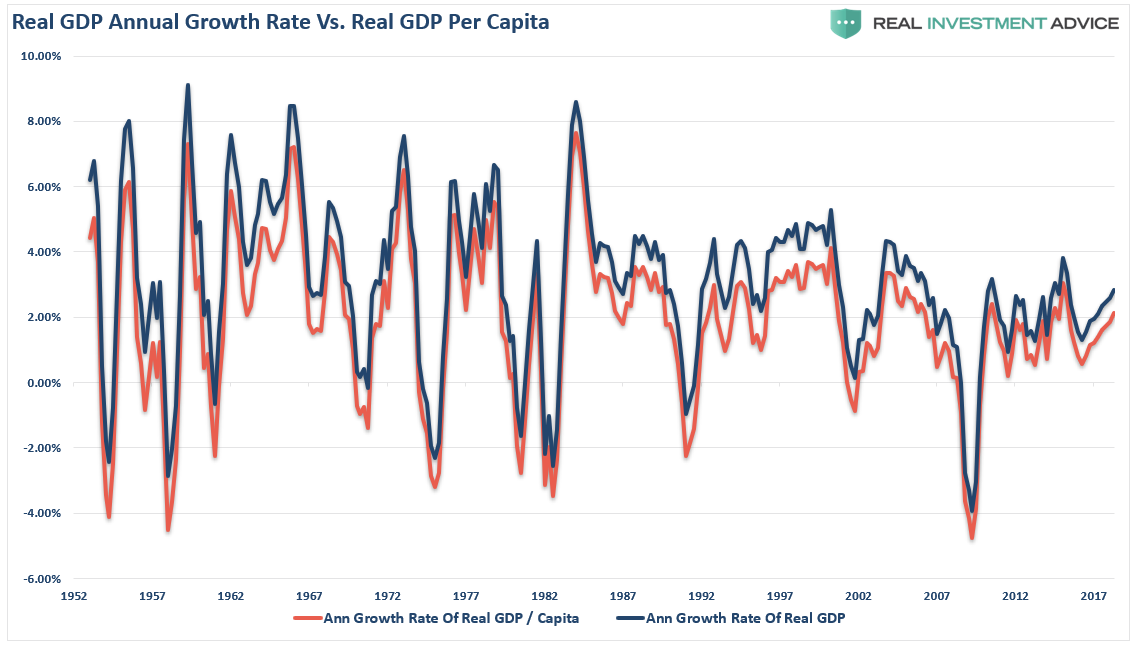
As you can see, once you adjust for population, the growth rate of the economy looks very different. However, we can see a clearer representation of the difference when looking at the average growth rate per decade. I have projected the data out, based on current assumptions, through 2025.
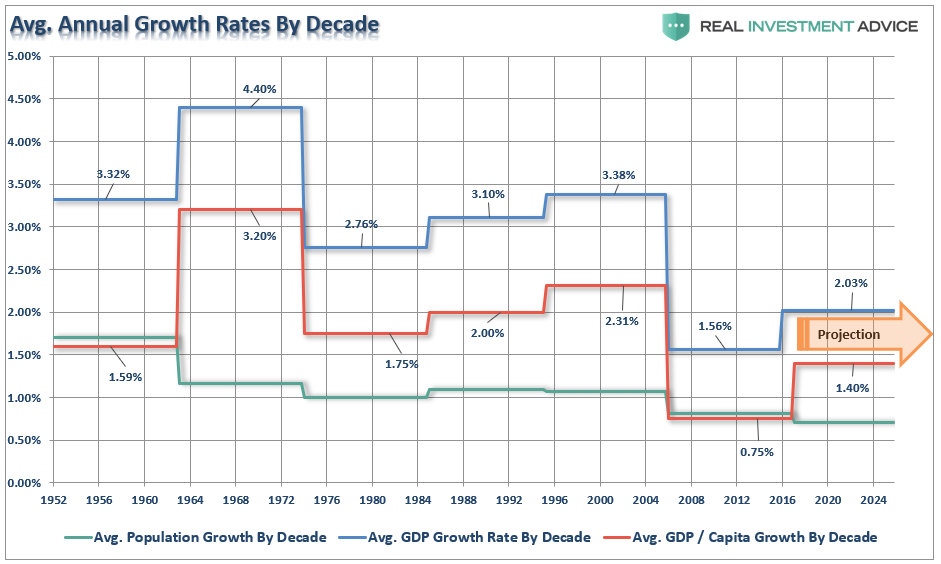
There is a significant difference between reported economic growth rates and GDP per capita. Currently, at just a 1.4% annual growth rate in GDP per capita going forward, the expectations for higher returns on investments must be reconsidered. It is unlikely, with debt to GDP ratios elevated, interest rates rising, and wages stagnant that higher rates of growth can be sustained.
It Wasn’t Really 4%
As was quoted previously, the second quarter GDP report was inflated by a number of one-off factors that will dissipate in the quarters ahead.
“An unusually large number of one-off factors appear to have boosted 2Q GDP, many of which are directly related to escalating trade concerns. As companies and countries race to secure supplies that may become expensive later on, exports have surged and inventories have swelled. If these trends are one-time adjustments (and our economists believe they are), the ‘payback’ in 2H could be significant. Enjoy the 2Q GDP number, which may be the last best print for a while.”
Our friends at the Committee for a Responsible Federal Budget provided a good piece of commentary showing the impacts of recent legislation and political actions.
“Most of this growth comes from the one-time surge in consumption that accompanies deficit-financed legislation. We recently estimated that other deficit-financed bills would generate a further 0.2 percent of growth.
At the same time, many analysts believe the second-quarter growth numbers are artificially inflated by shifts in consumption to avoid the new tariffs announced this quarter. Most significantly, China appears to have accelerated purchases of soybeans, crude oil, and other exports before new tariffs went into effect. Pantheon Macroeconomics estimated the soybean surge alone could account for as much 0.6 percentage points of the growth rate. These accelerated purchases mean faster growth now at the expense of slower growth later.
Assuming CBO’s numbers apply evenly on a quarterly basis and Pantheon’s numbers are correct, these temporary factors alone account for 1.4 percentage points of annual growth – meaning without them the second-quarter growth rate would fall to 2.7 percent. Even this 2.7 percent figure is likely inflated by the accelerated export of other goods, as well as one-time recovery effects.”
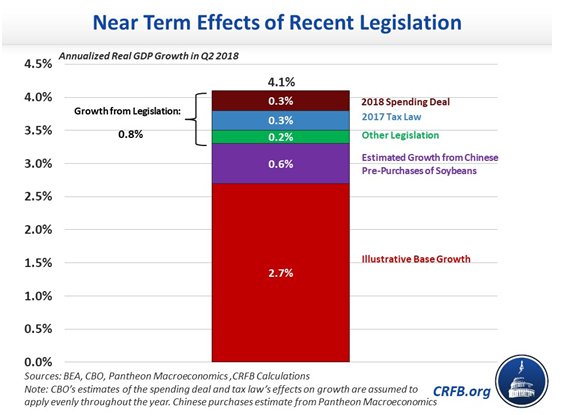
“Growth of 4.1 percent is a fast quarterly growth rate, the highest since the third quarter of 2014 (4.9 percent). Nevertheless, it’s notable that this growth rate is based on several temporary and predictable factors. But importantly, growth often fluctuates quarter to quarter – and over the course of the year, economic growth is likely to be significantly slower.”
We concur with that outlook and expect a significant softening of economic growth over the next couple of quarters. Furthermore, while a one-quarter anomaly is certainly good for media sound bytes, it is a far different matter when it comes to investing capital. The recent pop in economic growth did little to change the long-run dynamics of the economy as I showed previously. More importantly, the quality of economic growth continues to deteriorate due to structural shifts in the economic backdrop.
In modeling assumptions for future returns on invested capital, expectations of weaker economic growth rates must be considered. As we discussed in our third chapter of “Myths of Stocks For The Long Run” if:
- GDP maintains a 2% annualized growth rate, AND
- There are NO recessions….ever, AND
- Current market cap/GDP stays flat at 1.25, AND
- The current dividend yield of roughly 2% remains,
Using Dr. John Hussman’s formula we would get forward returns of:
(1.02)*(.8/1.25)^(1/30)-1+.02 = 2.5%
But there’s a “whole lotta ifs” in that assumption.
More importantly, if we assume that inflation remains stagnant at 2%, as the Fed hopes, this would mean a real rate of return of just 0.5%.
Economic growth matters, and it matters a lot.
As an investor, it is important to remember that in the end corporate earnings and profits are a function of the economy and not the other way around. Historically, GDP growth and revenues have grown at roughly equivalent rates.
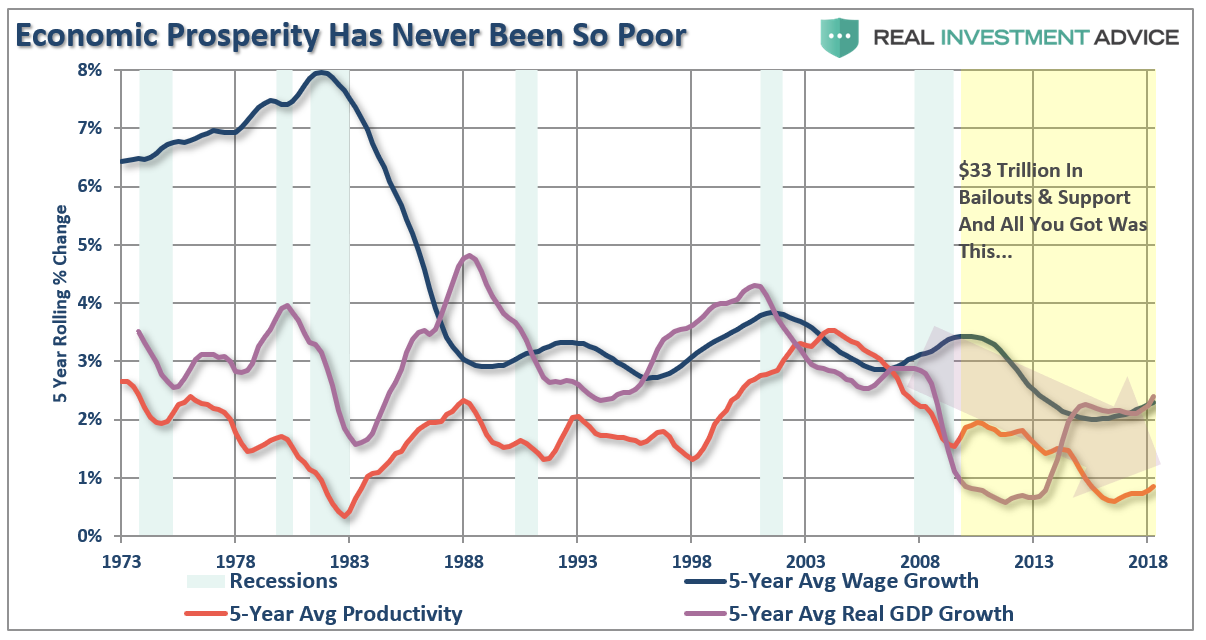
Forget the optimism surrounding “Trumpenomics” and focus on longer-term economic trends which have been declining for the past 30+ years. The economic trend is a function of a growing burden of debt, increasing demographic headwinds and, very importantly, declining productivity growth. I see little to make me believe these are changing in a meaningful way.
Lastly, do not forget that interest rates, despite recent increases, are near historical lows and the Feds balance sheet is still 4 times as large as it was before the financial crisis of 2008. Further, the U.S. Treasury will borrow $1.3 trillion this year which will directly feed economic growth. Just ask yourself where would the economy be if this extreme monetary and fiscal policy were not in place.
Still think everything is “hunky dory?”
Lance Roberts is a chief portfolio strategist and economist for Clarity Financial. He is also the host of "Street Talk with Lance Roberts," chief editor of "The X-Factor" Investment Newsletter and the Streettalklive daily blog. Follow Lance on Facebook, Twitter and LinkedIn.
© 2024 Newsmax Finance. All rights reserved.