What is important about China, besides being a major trading partner of the U.S., is that their economy has been a massive debt-driven experiment from building massive infrastructure projects that no one uses; to entire cities that no one lives in. However, the credit-driven impulse has maintained the illusion of economic growth over the last several years as China remained a major consumer of commodities. Yet despite the Government headlines of economic prosperity, the markets have been signaling a very different story.
In the U.S., the story is much the same. Near-term economic growth has been driven by artificial stimulus, government spending, and fiscal policy which provides an illusion of prosperity. For example, the chart below shows raw corporate profits (NIPA) both before, and after, tax.
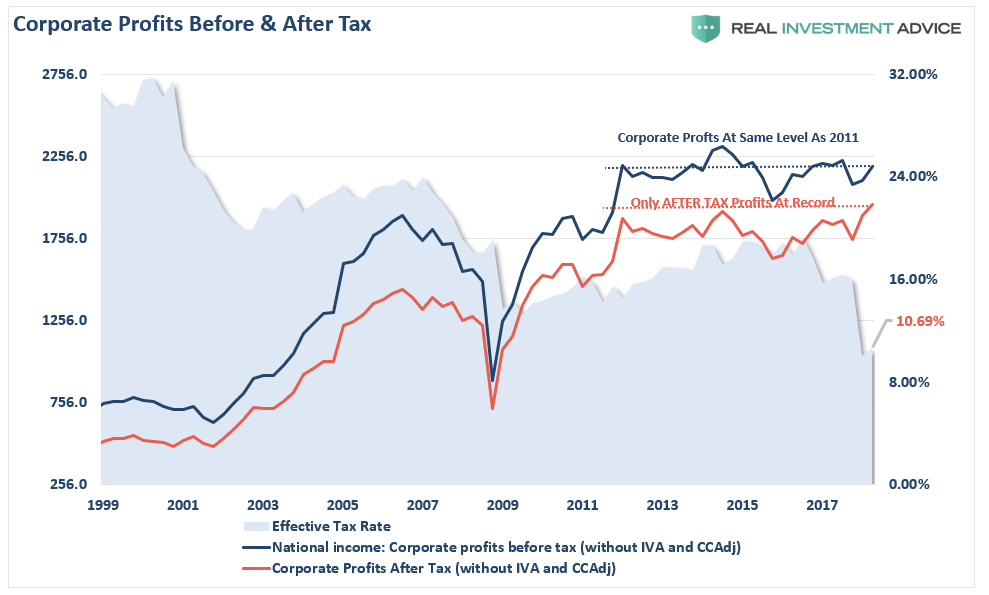
Importantly, note that corporate profits, pre-tax, are at the same level as in 2012. In other words, corporate profits have not grown over the last 6-years, yet it was the decline in the effective tax rate which pushed after-tax corporate profits to a record in the second quarter. Since consumption makes up roughly 70% of the economy, then corporate profits pre-tax profits should be growing if the economy was indeed growing substantially above 2%.
Corporate profitability is a lagging indicator of the economy as it is reported “after the fact.” As discussed previously, given that economic data in particular is subject to heavy backward revisions, the stock market tends to be a strong leading indicator of recessionary downturns.
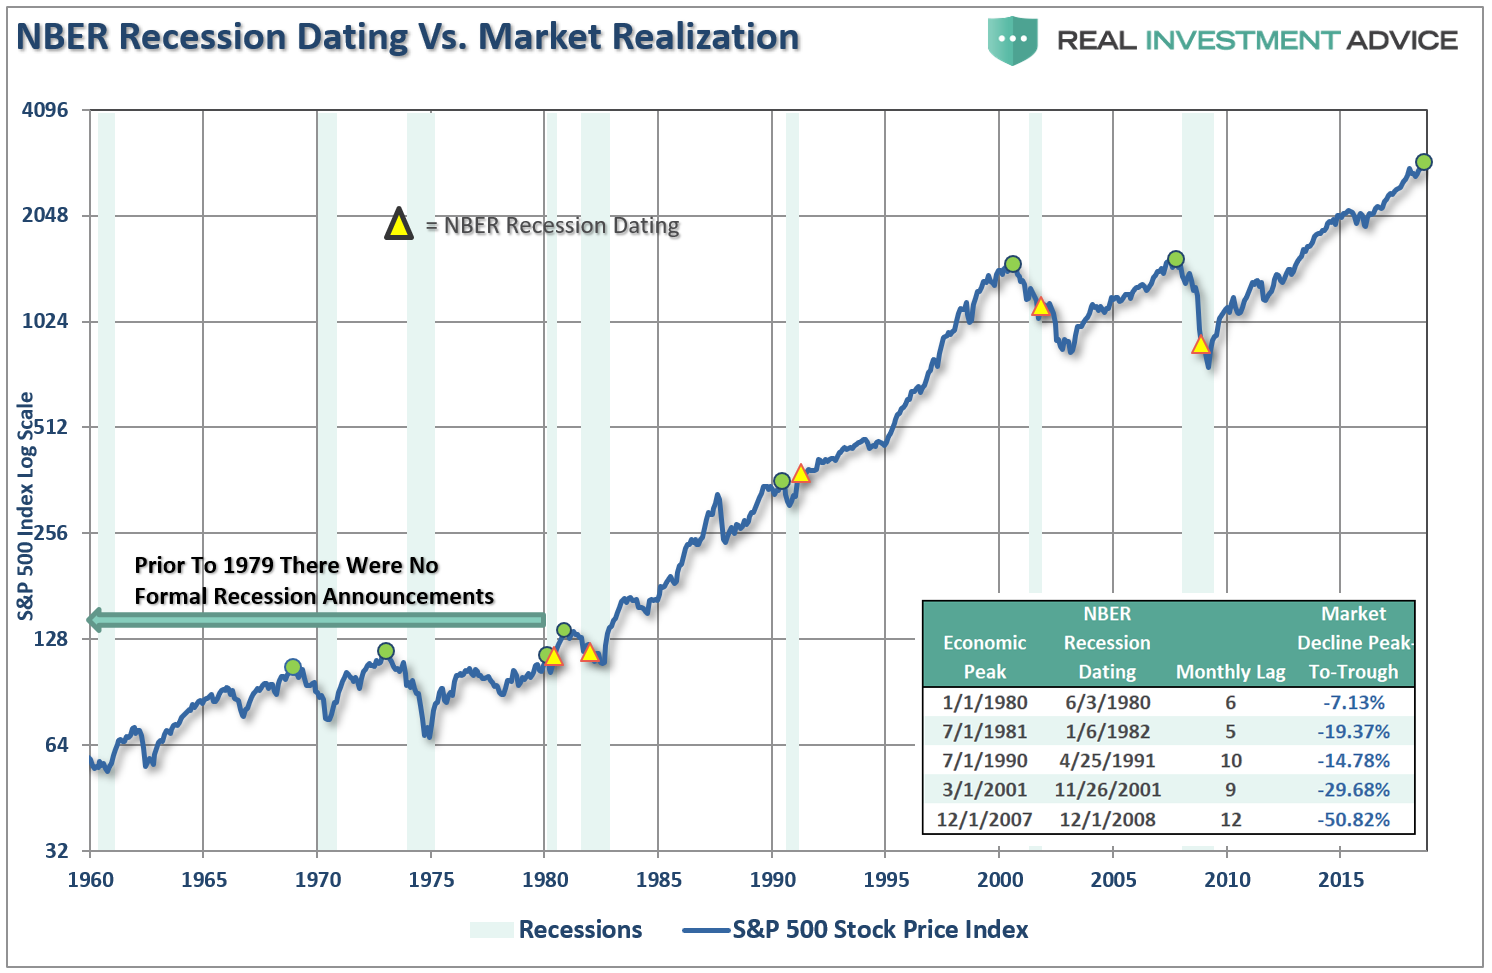
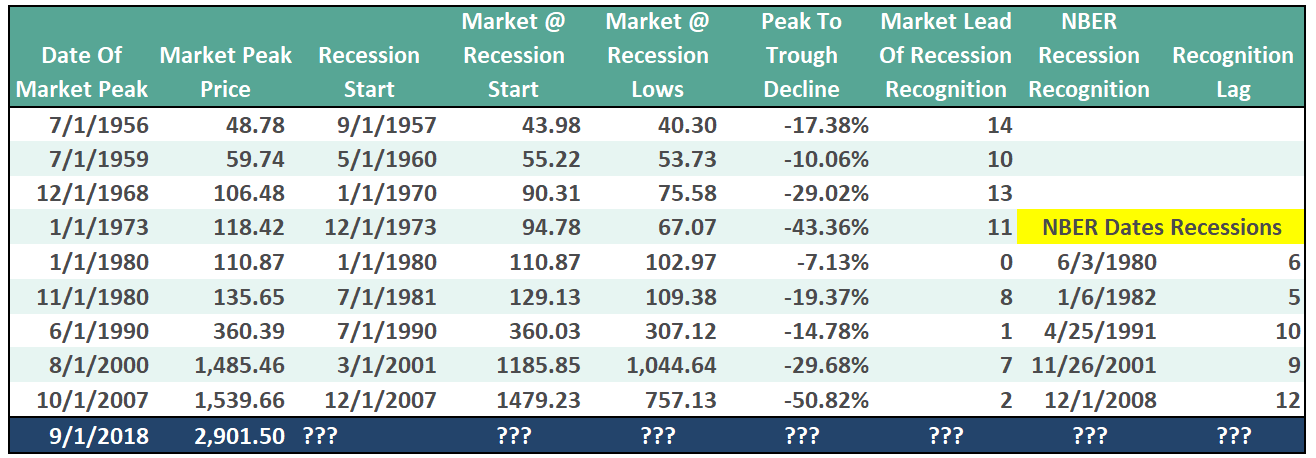
Prior to 1980, the NBER did not officially date recession starting and ending points, but the market turned lower prior to previous recessions.
Besides the stock market, economically sensitive commodities also have a tendency to signal changes to the overall trend of the economy given their direct input into both the production and demand sides of the economic equation.
Oil is a highly sensitive indicator relative to the expansion or contraction of the economy. Given that oil is consumed in virtually every aspect of our lives, from the food we eat to the products and services we buy, the demand side of the equation is a tell-tale sign of economic strength or weakness. This is shown in the chart below which shows oil prices relative to economic growth, inflation, and interest rates.
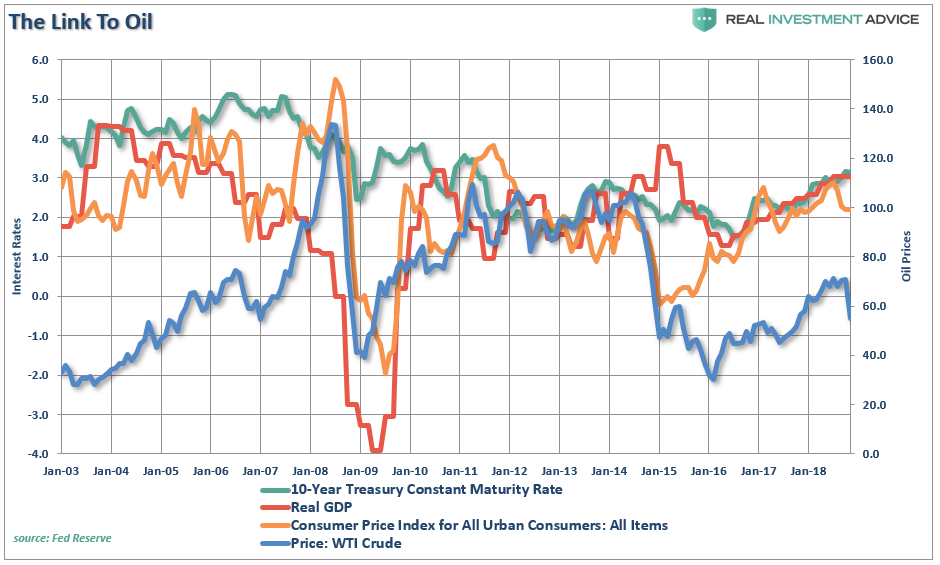
All this data is noisy, so the next chart combines rates, inflation, and GDP into one composite indicator to provide a clearer comparison. One important note is that oil tends to trade along a pretty defined trend…until it doesn’t. Given that the oil industry is very manufacturing and production intensive, breaks of price trends tend to be liquidation events which have a negative impact on the manufacturing and CapEx spending inputs into the GDP calculation.
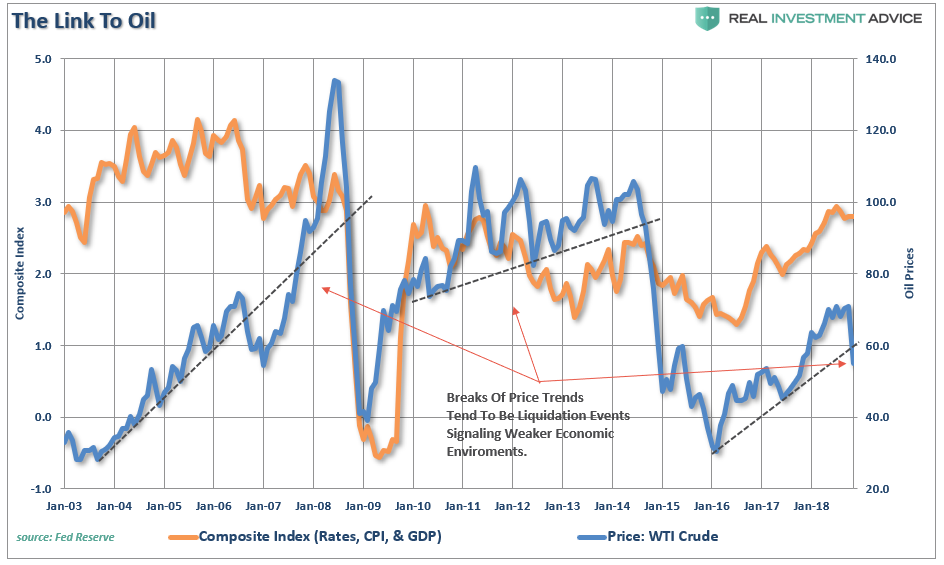
As such, it is not surprising that sharp declines in oil prices have been coincident with downturns in economic activity, a drop in inflation, and a subsequent decline in interest rates. The drop in oil prices is also confirming the message being sent by the broader market as well.
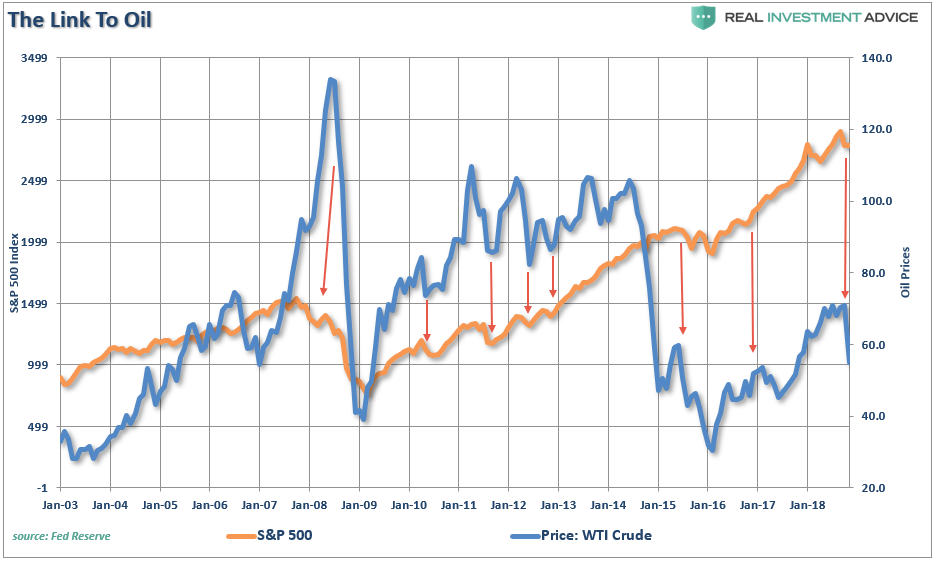
Again, given the massive input that oil has on the overall economy, declines in oil prices have a much broader impact on the overall economy than just the energy sector. But the decline in oil isn’t the only issue weighing on our outlook for the markets.
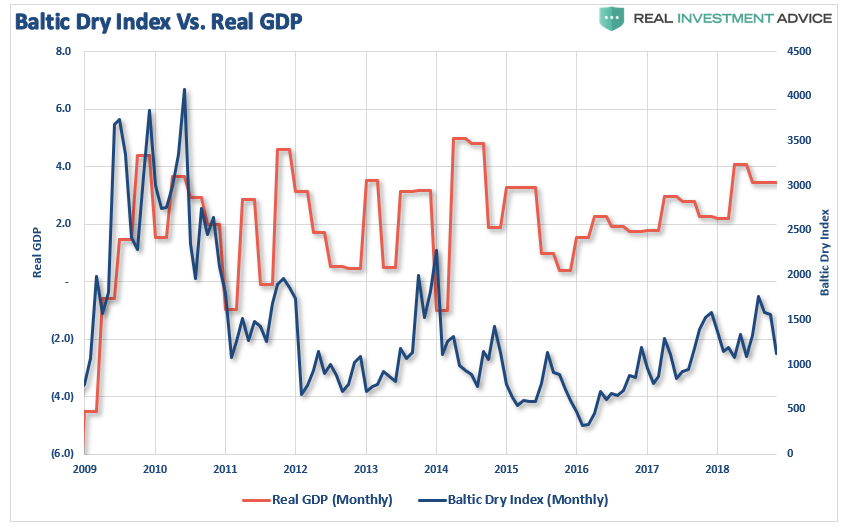
A look at Baltic Dry Index, which is just a representation of the demand to ship dry goods, shows weakness has begun to spread globally. The Baltic Dry Index, which is a non-traded index, bounced from the lows in 2016 as global central banks infused massive amounts of liquidity into the system to offset “Brexit” risks. However, the index also suggests the “reflationary” surge has now ended.
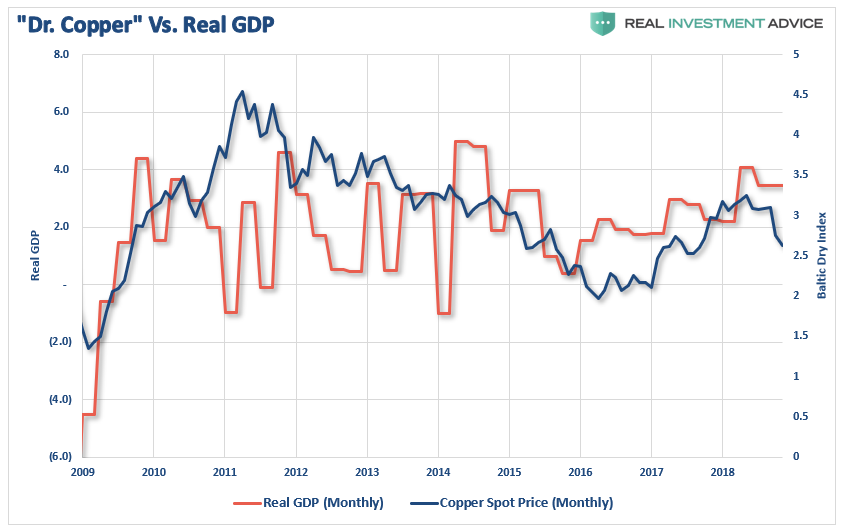
The same goes for copper which is highly correlated to overall economic strength due to its massive use throughout the production cycle both domestically and globally. The surge in liquidity in early-2016 was reflected with the “reflation” in a global economy which now appears to have ended.
Investment Implications
There are numerous signs suggesting a more pervasive economic weakness is spreading globally.
This is coming at a time where Central Banks globally are trying to remove “emergency measures” and reduce “accommodative” policies in order to rebuild their “toolkits” for the next economic downturn when it comes.
Unfortunately, the Federal Reserve’s insistence on increasing interest rates has likely accelerated the onset of the next recession. As I stated previously:
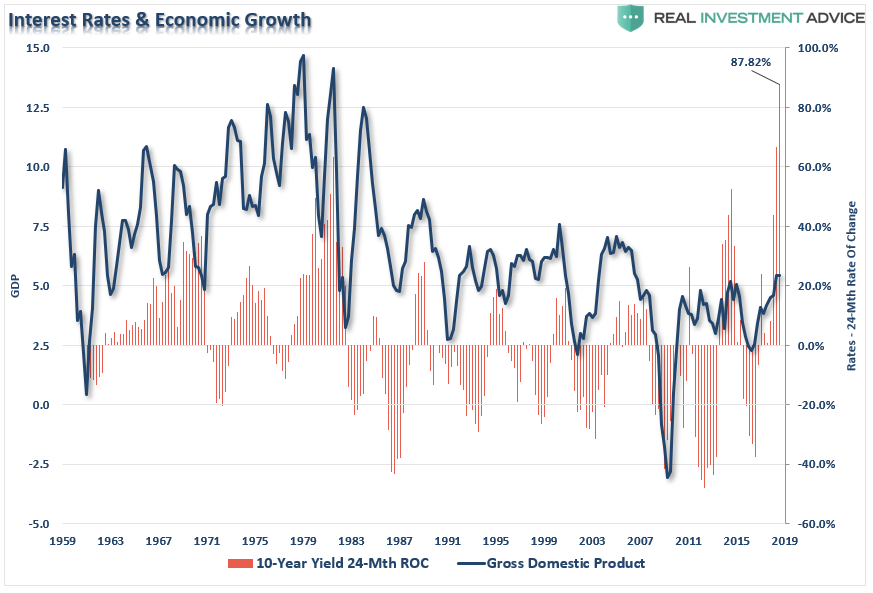
“The chart below shows nominal GDP versus the 24-month rate of change (ROC) of the 10-year Treasury yield. Not surprisingly, since 1959, every single spike in rates killed the economic growth narrative.”
The markets, oil, copper, and the Baltic dry index are all suggesting that economic growth has peaked.
Furthermore, the rise in the dollar over the last several weeks already suggests that foreign capital is flowing into the U.S. dollar for safety as the rest of globe slows. This will ultimately accelerate as global markets decline as foreign capital seeks “safety” in U.S. Treasuries (the global storehouse for reserve currencies).
As I have stated many times previously, as the economy slips into the next recession, interest rates will fall, and bonds will outperform equities as the reversion to the mean occurs.
From the equity perspective, this is a time to seriously consider reducing risk. While there is currently a rotation to more defensive areas of the market such as Staples, Utilities and Health Care currently, if a more negative overall trend develops in the markets these sectors will lose ground as well.
One of the big concerns remains overall valuations which are elevated in traditionally “more defensive” areas of the market due to the “yield chase” over the last decade. If there is a recessionary drag which causes a repricing of “value” in the market, there could be significant risk to these areas.
When there is uncertainty, particularly during a market topping process where trends are beginning to change direction, cash is the best option. It provides safety, liquidity, and opportunity. This particularly the case as the 2-year Treasury yields more than the S&P 500 index which provide an “alternative” to excessive risk.
The evidence continues to mount that “something has changed.”
The only problem with waiting for absolute confirmation is the potential for significant capital destruction. As investors, our job is simply to weigh the risk and reward of each investment opportunity. Currently, there are significant “warnings” that suggest “risk” continues to outweigh “reward.”
That outlook will eventually change, When it does, and real opportunity presents itself, having liquid cash on hand provides the ability to be a “strong buyer from weak hands.”
Lance Roberts is a chief portfolio strategist and economist for Clarity Financial. He is also the host of "Street Talk with Lance Roberts," chief editor of "The X-Factor" Investment Newsletter and the Streettalklive daily blog. Follow Lance on Facebook, Twitter and LinkedIn.