There is in interesting dichotomy currently occurring within the economy. While consumer confidence, as reported by the Census Bureau, soared to some of the highest levels seen since the turn of the century, the hard economic data continues to remain quite weak. As noted by Morgan Stanley just recently:
“Compare the New York Federal Reserve Bank’s current 1Q GDP tracking vs ours – FRBNY is currently tracking 1Q GDP at 3.0% versus us around 1%. The difference is larger than usual and is being driven by the fact that the New York Fed incorporates soft data into its tracking (attempting to tie it econometrically to GDP, a very hard thing to do especially in real-time). Our method translates the incoming hard data into its GDP equivalent. Note that the Atlanta Fed’s GDPNow tracking also focuses on hard data and is currently tracking 1% for 1Q GDP.”
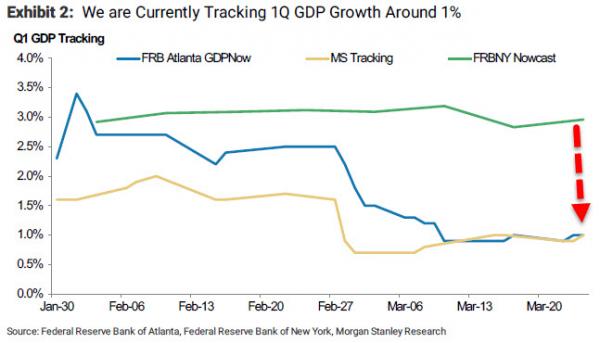
The stunning divergence can be seen in the chart attached to that same article which shows the difference between the “hard” and “soft” data specifically.
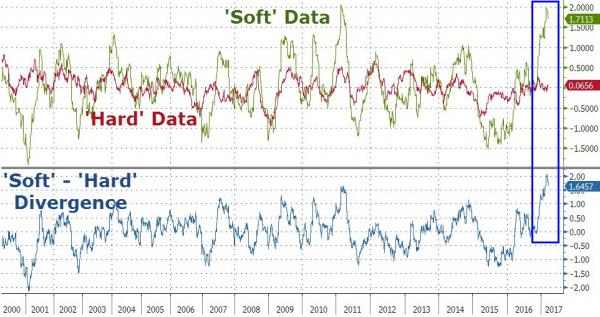
What is currently expected by those with a more “bullish bias” is the hard data will soon play catch up with the soft data. Importantly, as I discussed in “Fade To Black”, this is the basis of the markets continued optimism that tax reforms, repatriations and infrastructure spending create the “reflationary” dynamics necessary to spur economic growth of 3-4%.
However, there may be a problem.
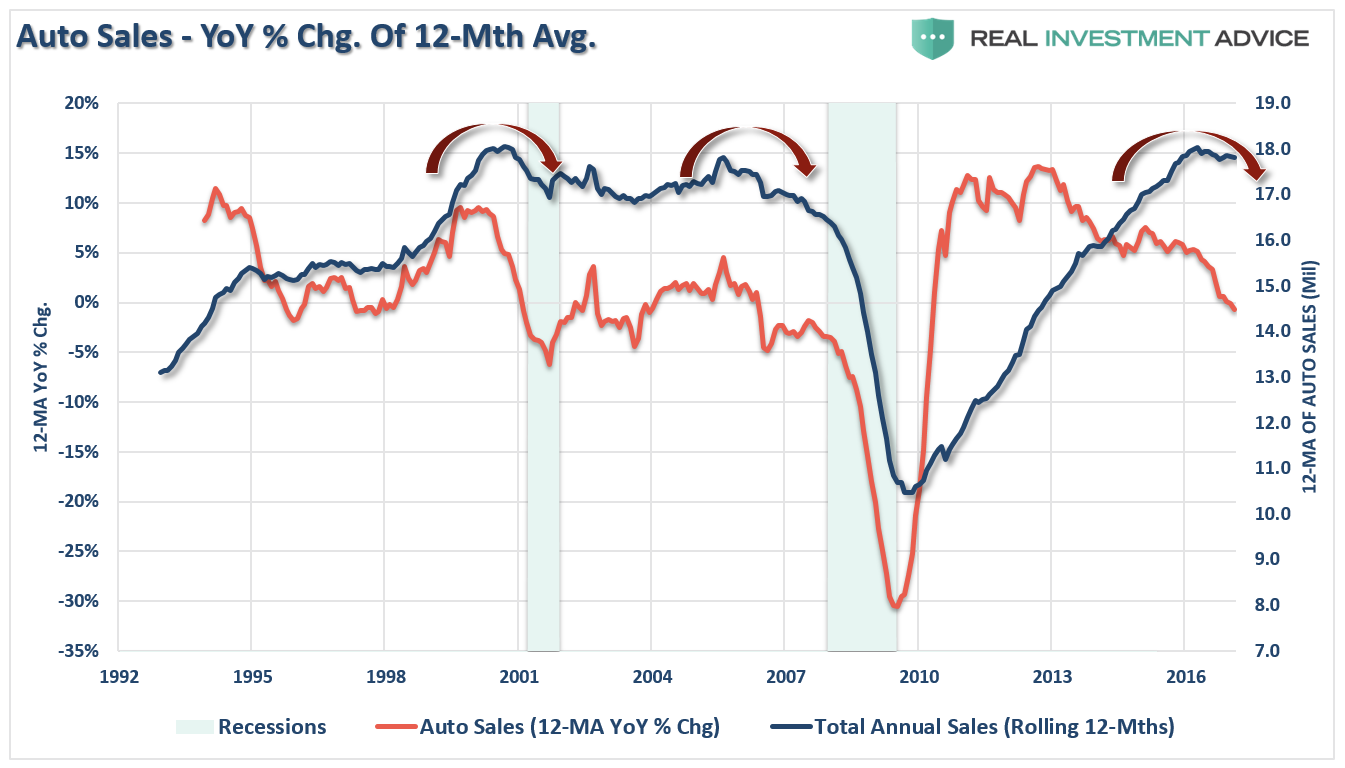
Economic cycles do not last indefinitely. While fiscal and monetary policies can extend cycles by “pulling forward” future consumption, such actions create an eventual “void” that cannot be filled. In fact, there is mounting evidence the “event horizon” may have been reached as seen through the lens of auto sales.
Following the financial crisis the average age of vehicles on the road had gotten fairly extended so a replacement cycle became more likely. This replacement cycle was accelerated when the Obama Administration launched the “cash for clunkers” program which reduced the number of “used” vehicles for sale pushing individuals into new cars. Combine replacement needs with low interest rates, easy financing, and extended terms and you get a sales cycle as shown below.
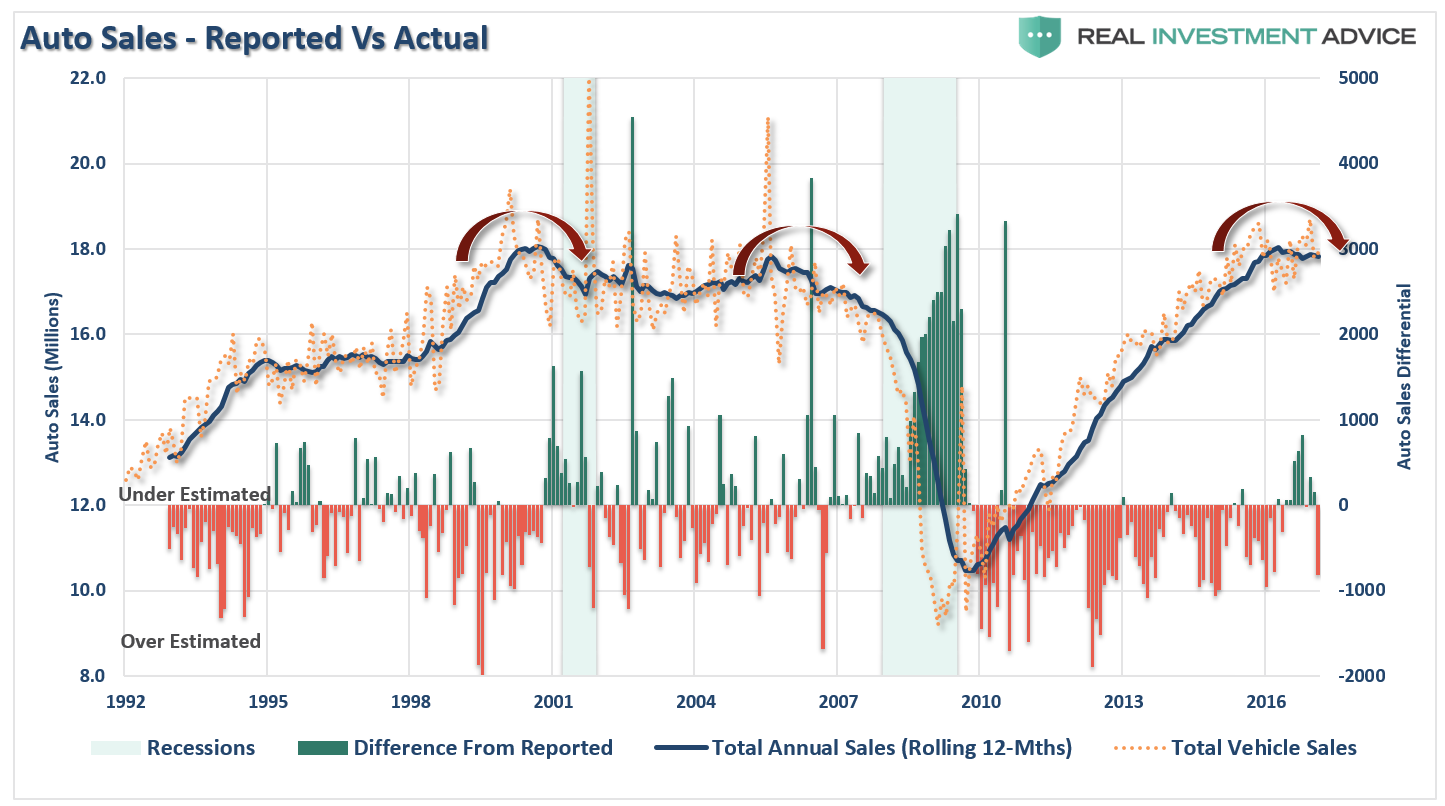
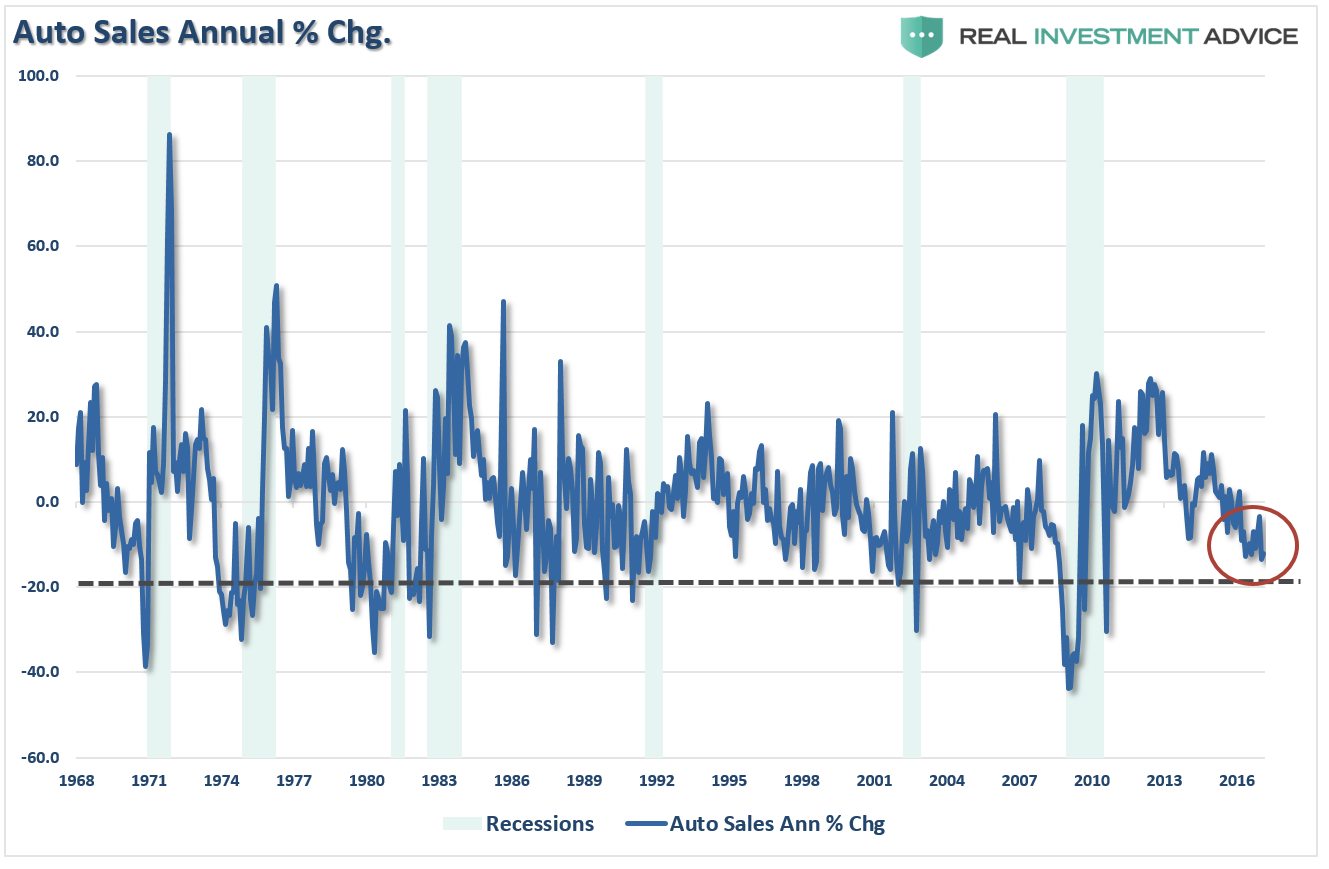
(Note: When auto sales are reported each month they are annualized. The bar chart shows the over/underestimation of auto sales each month as compared to what actually occurred on an annual basis.)
The issue is, of course, there are only a finite number of people to sell new cars too.
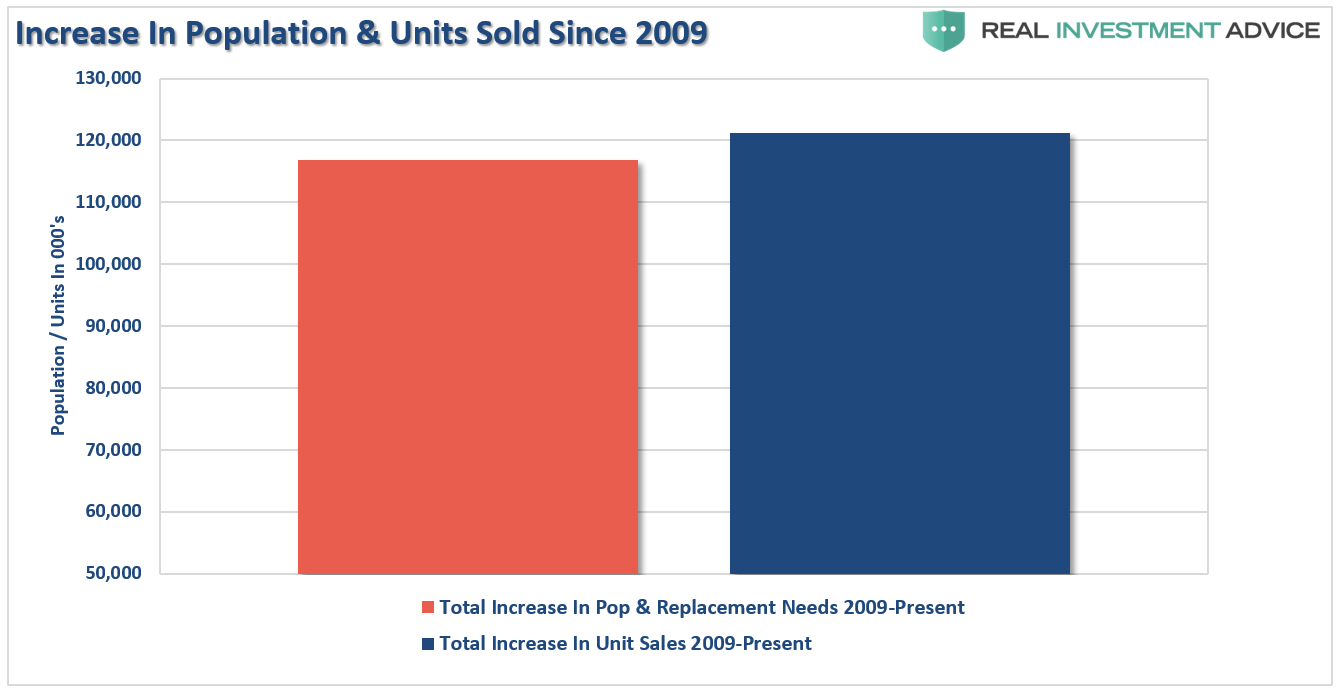
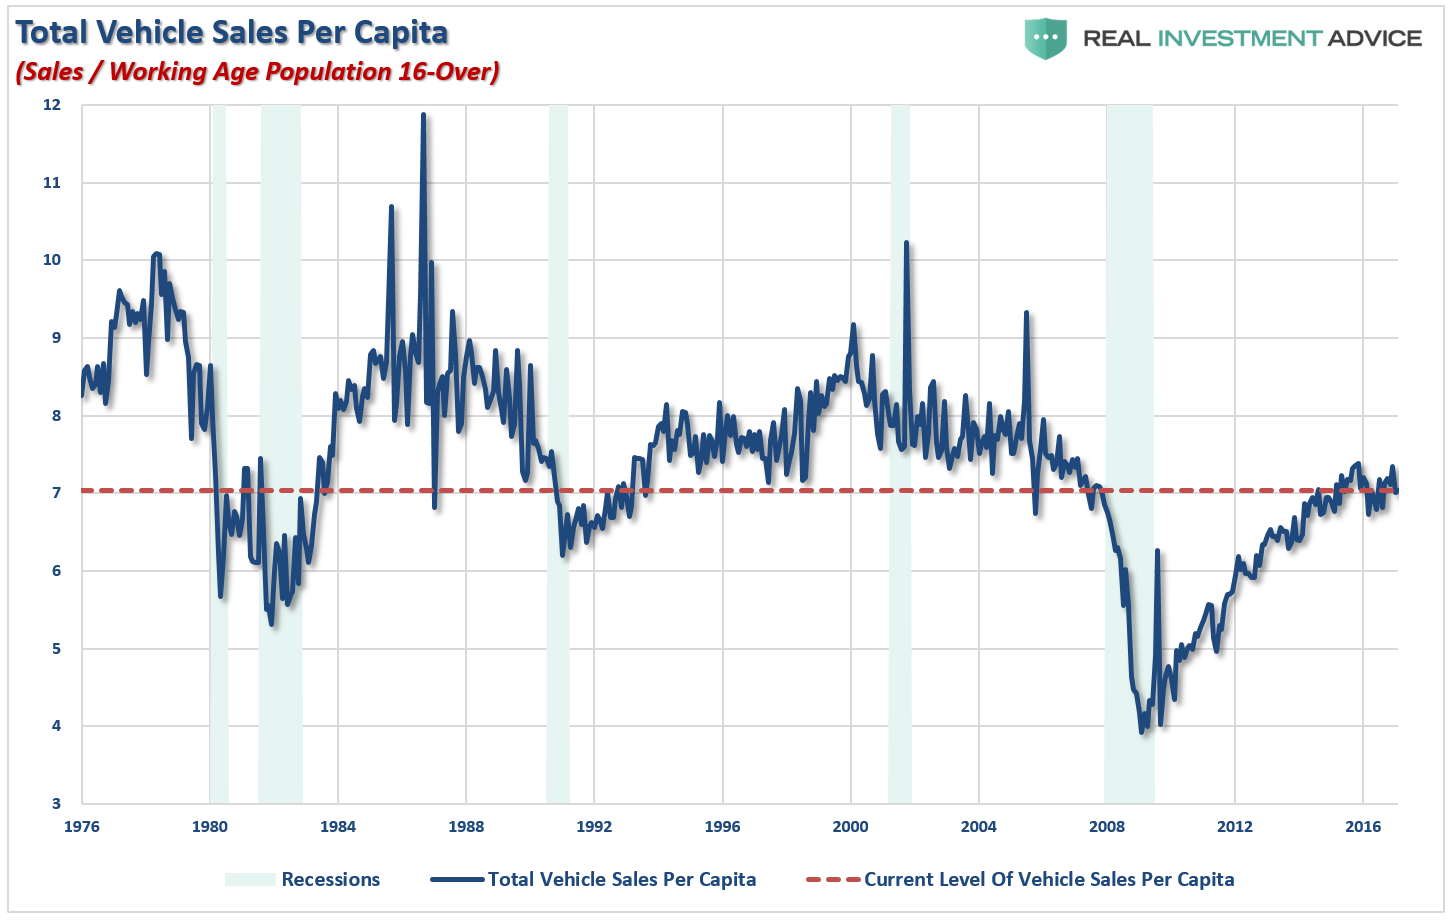
What the chart above shows is the number of cars sold currently now exceeds both the total increase in population and replacement needs of the existing population. In other words, the pool of available buyers is rapidly being depleted.
But more importantly, while the media touts “record auto sales,” it is a far different story when compared to the increase in the population. With total sales only slightly eclipsing the previous record, given the increase in the population this is not the victory the media wishes to make it sound. In fact, the current level of auto sales on a per capita basis is only back to where near the bottom of recessions with the exception of the “financial crisis.”
Furthermore, the annual rate of auto sales has slowed dramatically and is approaching levels normally associated with more severe economic weakness.
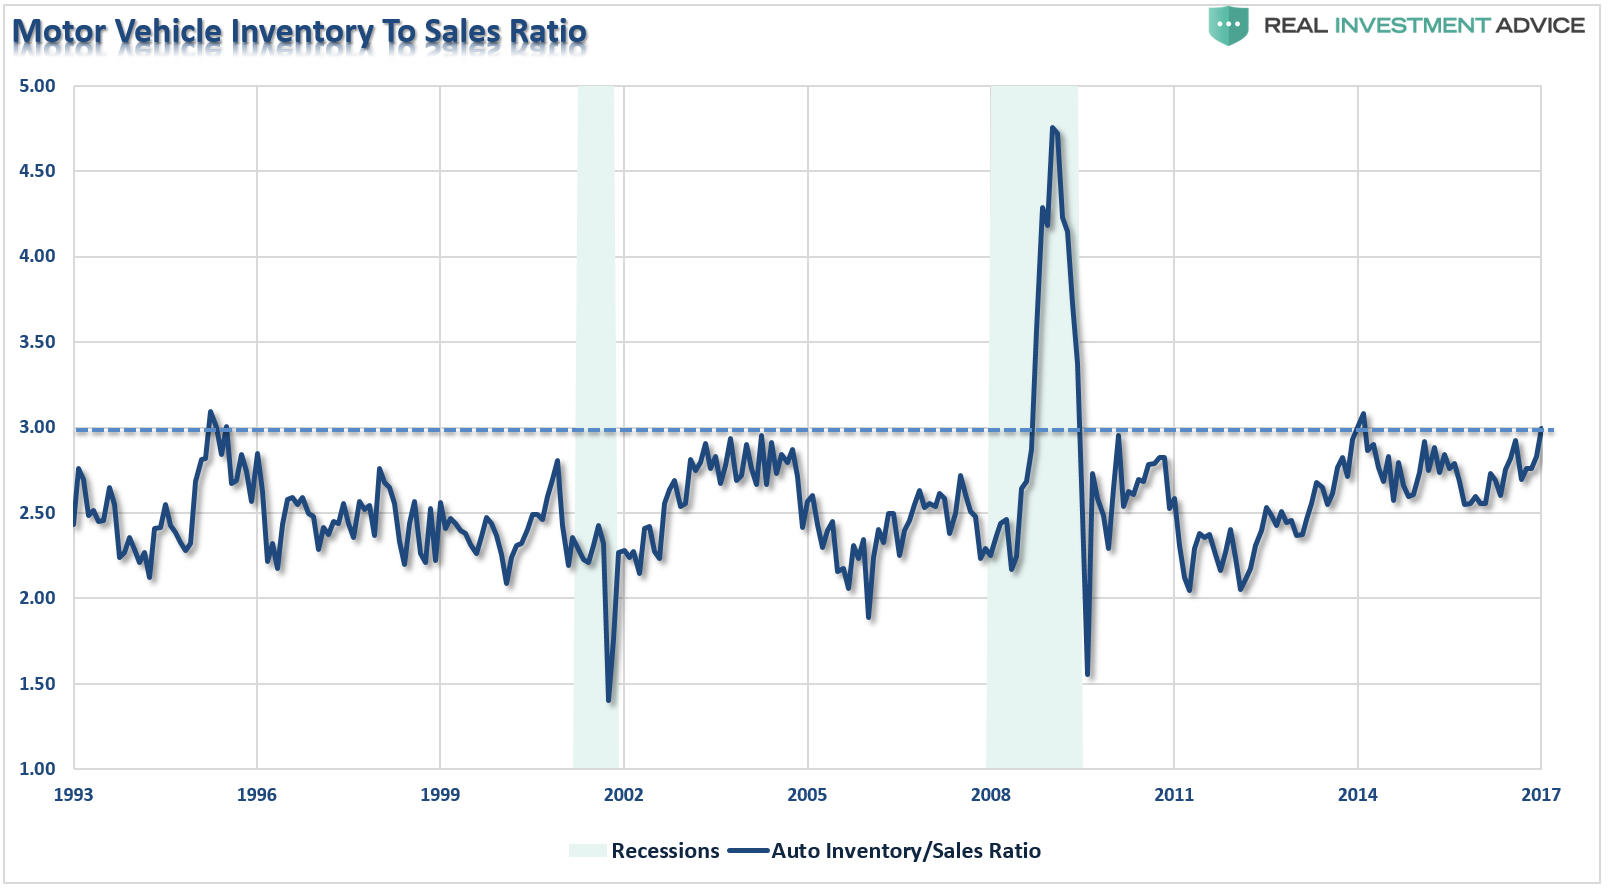
But slowing auto sales is only one-half of the problem. The problem for automakers is, as always, they continue to produce inventory even though demand is slowing. The cars are then shifted to dealers which have to resort to increasing levels of incentives to get the inventory sold. However, eventually, this is a losing game. The chart below shows the current level of swelling inventories relative to sales.
There is a limit to the level of incentives that dealers can provide to move inventory. Wolf Richter recently penned a really good report on this issue:
“J.D. Power and LMC Automotive pegged incentives at $3,768 per new vehicle sold – the highest ever for any March. The prior record for March was achieved in 2009 as the industry was collapsing. In June 2009, GM filed for bankruptcy.”
The Subprime Problem Resurfaces
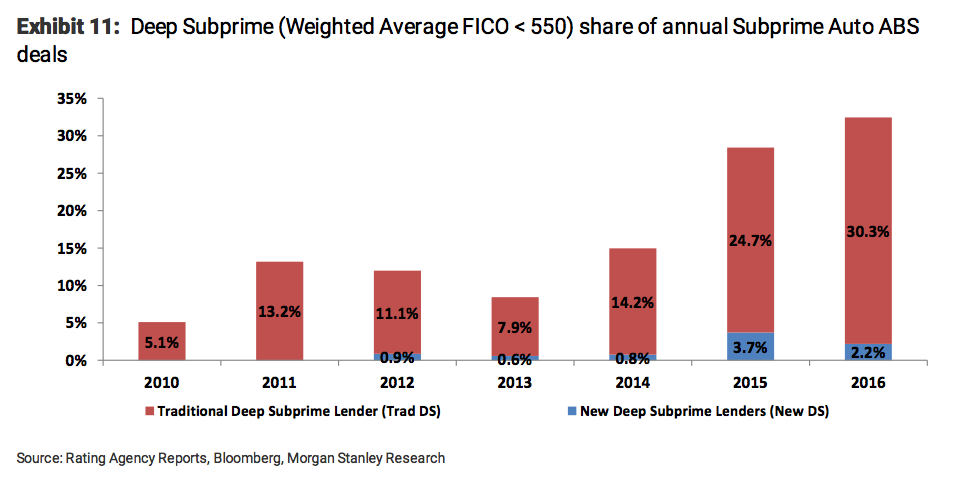
Given the lack of wage growth, consumers are needing to get payments down to levels where they can afford them. Furthermore, about 1/3rd of the loans are going to individuals with credit scores averaging 550 which carry much higher rates up to 20%. In fact, since 2010, the share of sub-prime Auto ABS origination has come from deep subprime deals which have increased from just 5.1% in 2010 to 32.5% currently. That growth has been augmented by the emergence of new deep sub-prime lenders which are lenders who did not issue loans prior to 2012.
While there has been much touting of the strength of the consumer in recent years, it has been a credit driven mirage. With income growth weak, debt levels elevated and rent and health care costs chipping away at disposable incomes, in order to make payments even remotely possible, terms are often stretched to 84 months.
The eventual issue is that since cars are typically turned over every 3-5 years on average, borrowers are typically upside down in their vehicle when it comes time to trade it in. Between the negative equity of their trade-in, along with title, taxes, and license fees, and a hefty dealer profit rolled into the original loan, there is going to be a substantial problem down the road. As noted by Reuters:
“Typically, car dealers tack on an amount equal to the negative equity to a loan for the consumers’ next vehicle. To keep the monthly payments stable, the new credit is for a greater length of time.
Over the course of multiple trade-ins, negative equity accumulates. Moody’s calls this the ‘trade-in treadmill,’ the result of which is ‘increasing lender risk, with larger and larger loss-severity exposure.’
To ease consumers’ monthly payments, auto manufacturers could subsidize lenders or increase incentives to reduce purchase prices, though either action would reduce their profits, the report said.”
Auto loans, in general, have been in a huge boom that reached $1.11 trillion in the fourth quarter 2016. As noted above, 33.5% of those loans are sub-prime, or $371.85 billion.
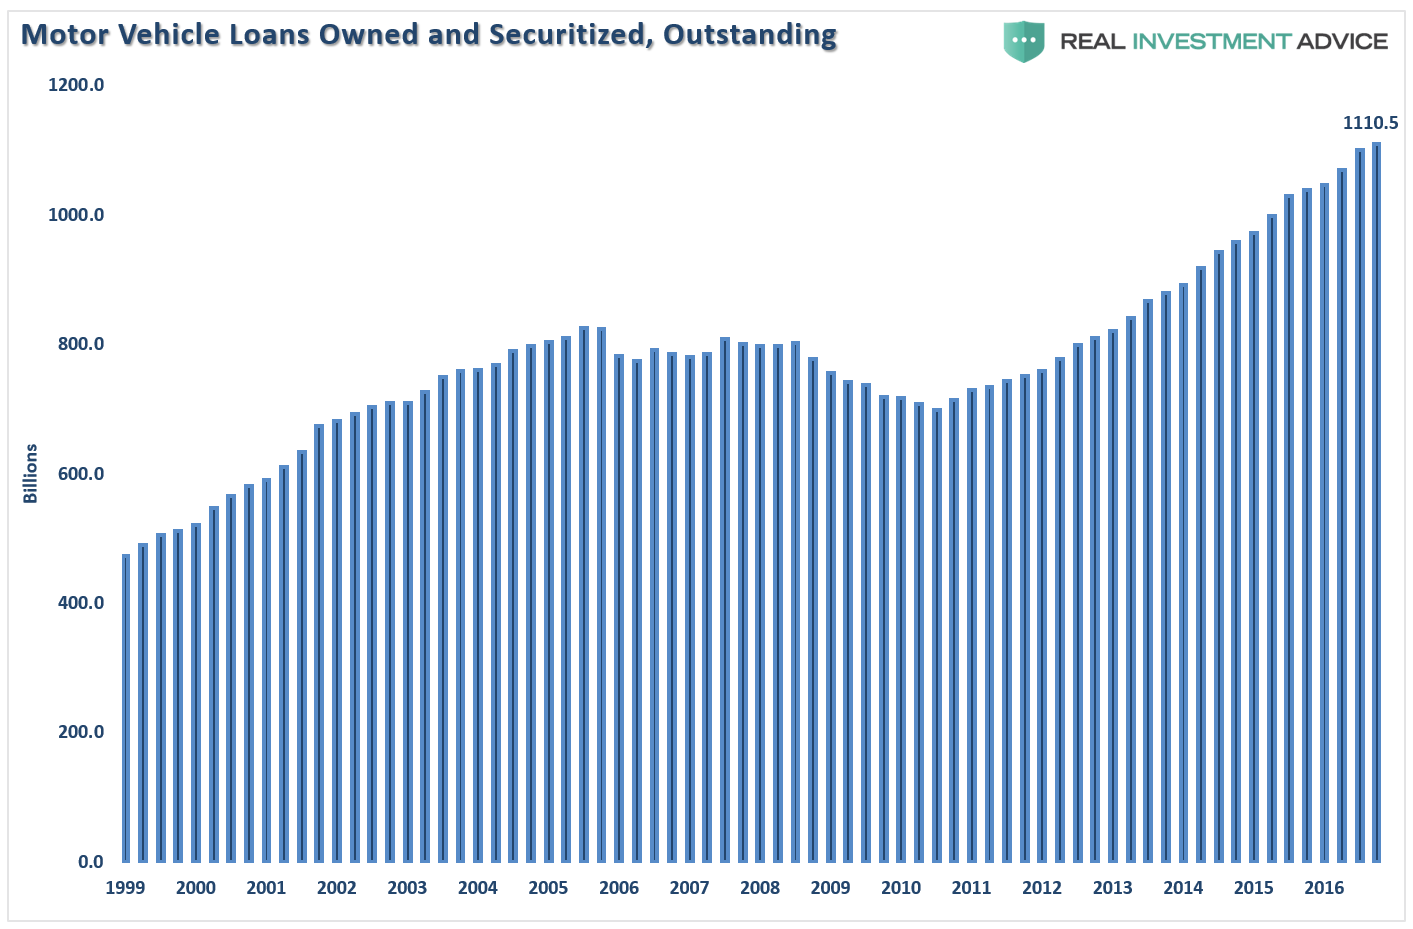
With more sub-prime auto loans outstanding currently than prior to the financial crisis, defaults rising rapidly and a large majority with negative equity in their vehicles, swapping out to a new car is becoming a near impossible option. Recently, Matt Turner cobbled together some interesting data from several sources on this issue.
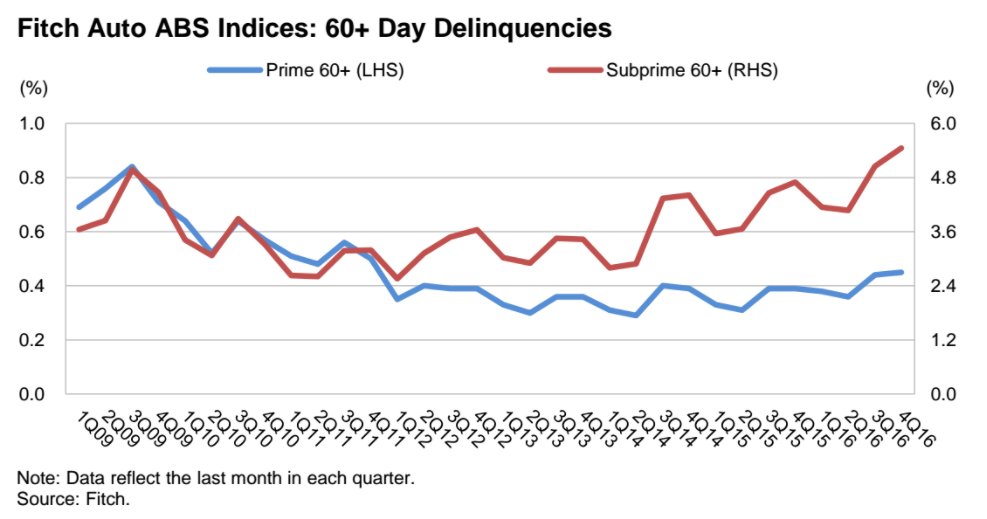
The 60-day delinquency rate for subprime auto loans is at the highest level in at least seven years according to Fitch. The jump in losses on sub-prime auto loans moved to 9.1% in January, up from 7.9% a year earlier. The data suggests there is notable deterioration in the performance of these loans and given there are roughly 6-million individuals at least 90-days late on payments suggests rising stress levels of the consumer.
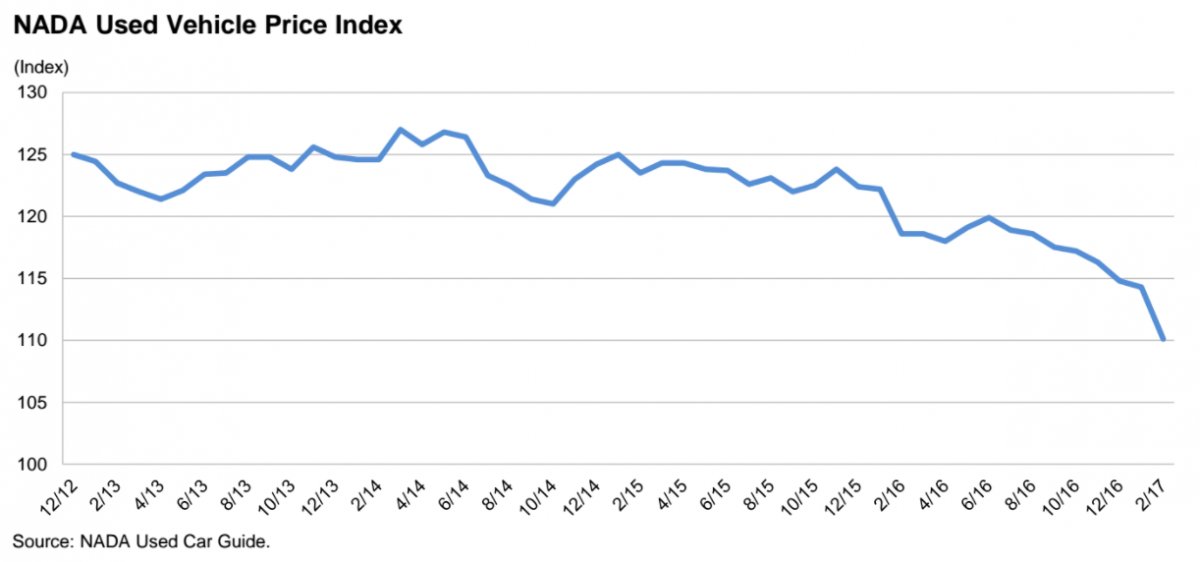
While the “cash for clunkers” program by the Obama Administration caused a massive surge in used vehicle prices due to the rapid depletion of inventory at the time, much of that inventory has now been rebuilt. Now, used vehicle prices are dropping sharply, as the market is flooded with off-lease vehicles and consumer demand is weakening.
As noted above, the issue of the “trade-in treadmill” is a major issue for auto lenders as default risk continues to increase. Per Moody’s:
“The percentage of trade-ins with negative equity is at an all-time high, as is the average dollar amount of that negative equity. Lenders are increasingly faced with the choice of taking on greater risk by rolling negative equity at trade-in into the next vehicle loan. We believe they are increasingly taking this choice, resulting in mounting negative equity with successive new-car purchases.”

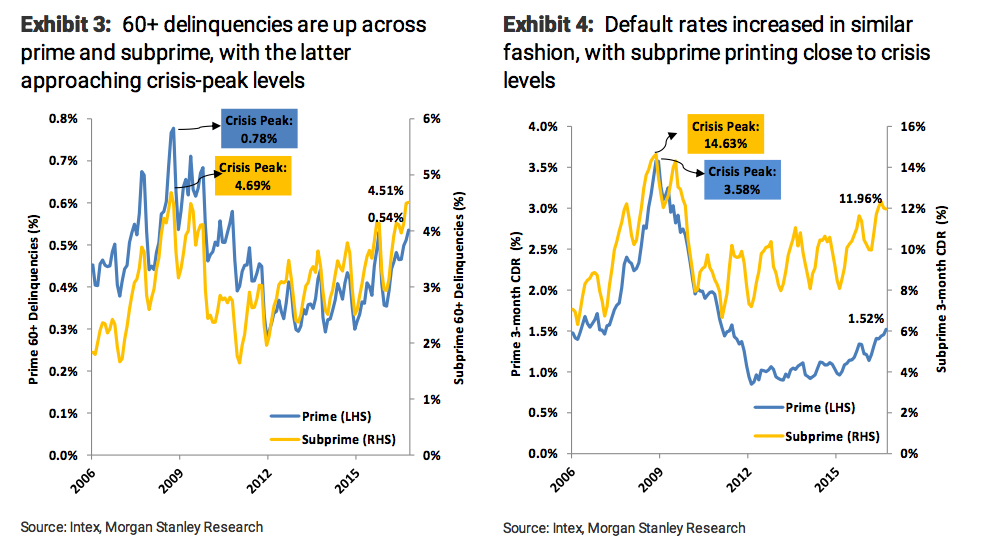
Asset-backed securities based on auto loans are showing signs of stress, with the subprime auto ABS delinquency rate closing in on crisis-era peak levels. Per Morgan Stanley:
“Across prime and subprime ABS, 60+ delinquencies are currently printing at 0.54% and 4.51%, respectively, with the latter approaching crisis-era peak levels (4.69%). Default rates are also picking up in similar fashion (prime: 1.52%; subprime: 11.96%), printing close to crisis levels. While prime severities slowly crept past 50% recently, subprime severities have breached 60%, a level we haven’t seen since late 2009. With both default rates and loss severities trending up, it is no surprise to see annualized net loss rates moving in the same direction.”
Given the importance of automobiles to the domestic manufacturing sector of the economy, the extent to which the sale of autos to consumers has likely reached an important inflection point. As shown in the last chart below, the previous recessionary warnings from autos was dismissed until far too late, it is likely not a good idea to dismiss it this time.
Why does this matter? Because it isn’t just auto loans. As Edward Harrison at Credit Writedowns noted:
“The big three areas of credit expansion this cycle – energy, auto and student loans.”
In the fall 2016 survey ahead of the latest borrowing reassessment this past October, Haynes and Boone said that respondents on average expected 41 percent of the borrowers to see a decrease. This decrease was expected at an average of 20 percent, in which lenders were expecting a 16-percent decrease and borrowers a 29-percent decrease.
While energy prices recovered enough to allow drillers to start back operations, primarily in the Permian Basin, the surge in supply is leading to another potential glut by 2018 and another downturn in oil prices. Such an event will put further strain on lenders as default risk rise in the sector.
Currently, 42.4 million Americans owe $1.3 trillion in federal student loans. More than 4.2 million borrowers were in default as of the end of 2016, up from 3.6 million in 2015. In all, 1.1 million more borrowers went into or re-entered default last year.
And then there is also the problem of commercial real estate (CRE) where rapid loan growth over the past year, combined with recent underwriting reviews, raise many concerns over the quality of CRE risk management, particularly managing concentrations. Add to that weak underwriting and erosion of covenant protections in leveraged lending and you have real problems.
So, if you are wondering where the next “economic shock” may come from...there is a “clear and present danger” lurking below the headlines.
Lance Roberts is a chief portfolio strategist and economist for Clarity Financial.
© 2024 Newsmax Finance. All rights reserved.