Last week, I discussed the issues behind President Trump’s announced “tax plan” and why, due to the increase in the national debt, that it may not spur the economic growth that has been promised. This week, I want to look at the issue from the personal income tax view.
In the economy today, personal consumption expenditures make up roughly 70% of the economic equation as shown in the chart below.
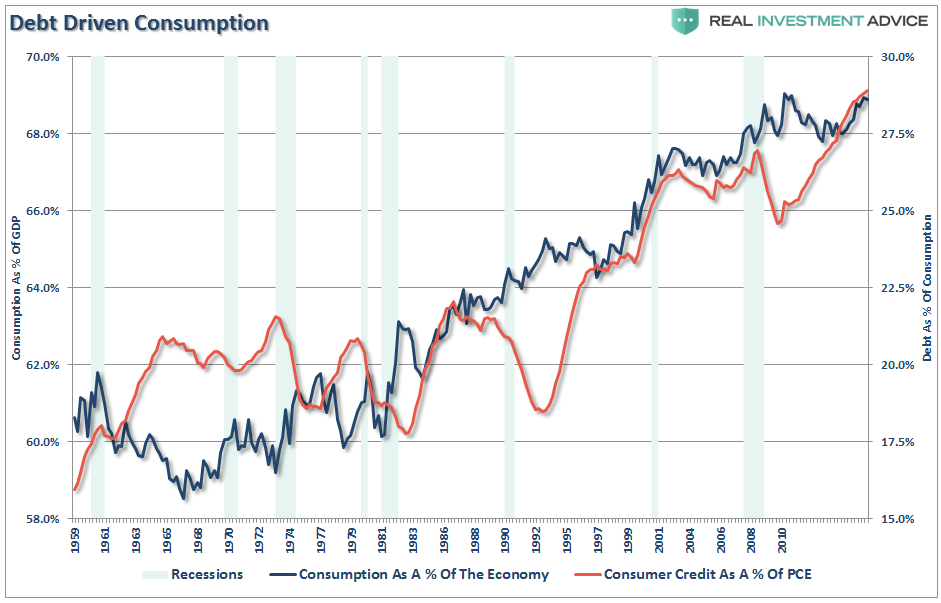
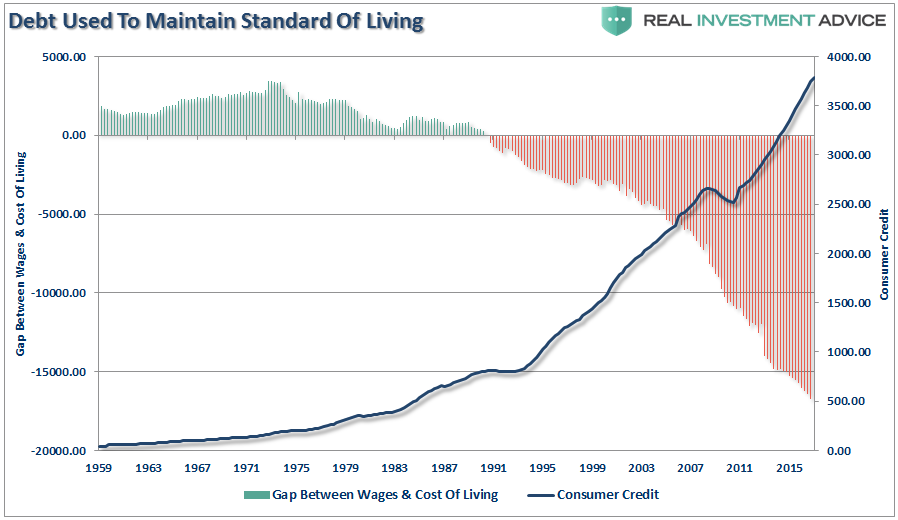
Of course, given that wage growth has been on the decline since the 1980’s, it is no surprise debt has been used to supplant the differential between incomes and the “expected” standard of living.
Currently, it is widely espoused that tax reform/cuts delivered to the middle class will spur economic growth. This assumption is based upon the post-Reagan tax cut history as a baseline for what to expect in the future.
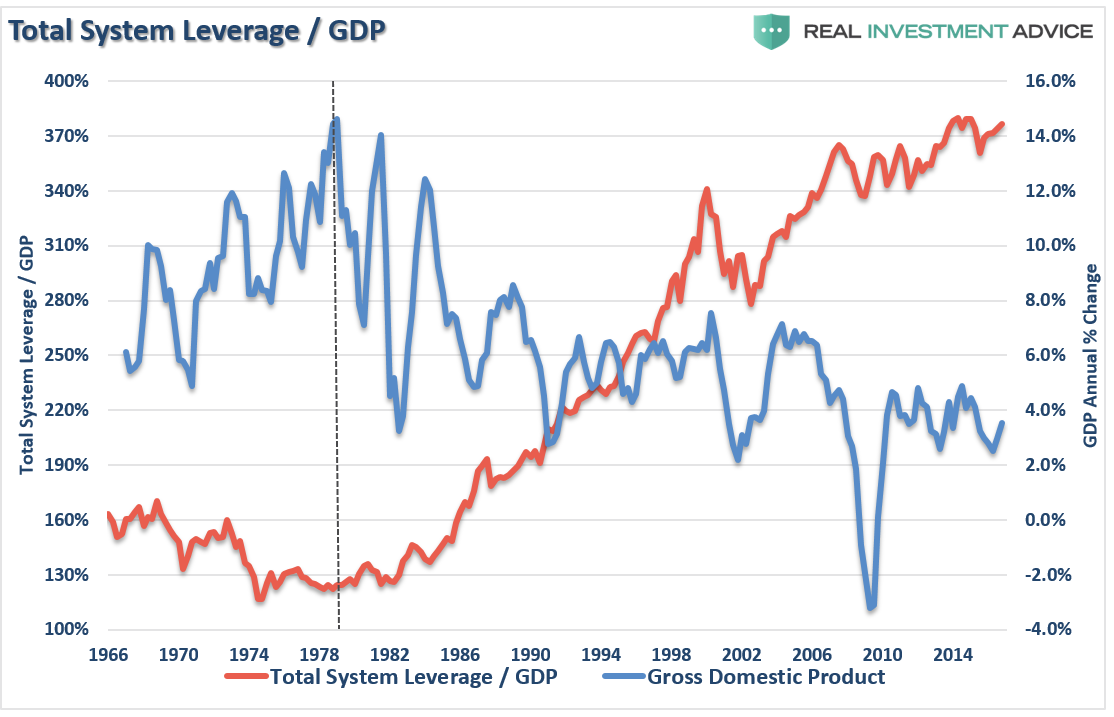
However, as I discussed last time, there is a massive difference between the economy today and that of Reagan. As shown in the chart below, total debt and leverage has surged to levels that have become a sustainable economic drag. (The dashed black line was the demarcation point where living beyond our means became the standard mentality.)
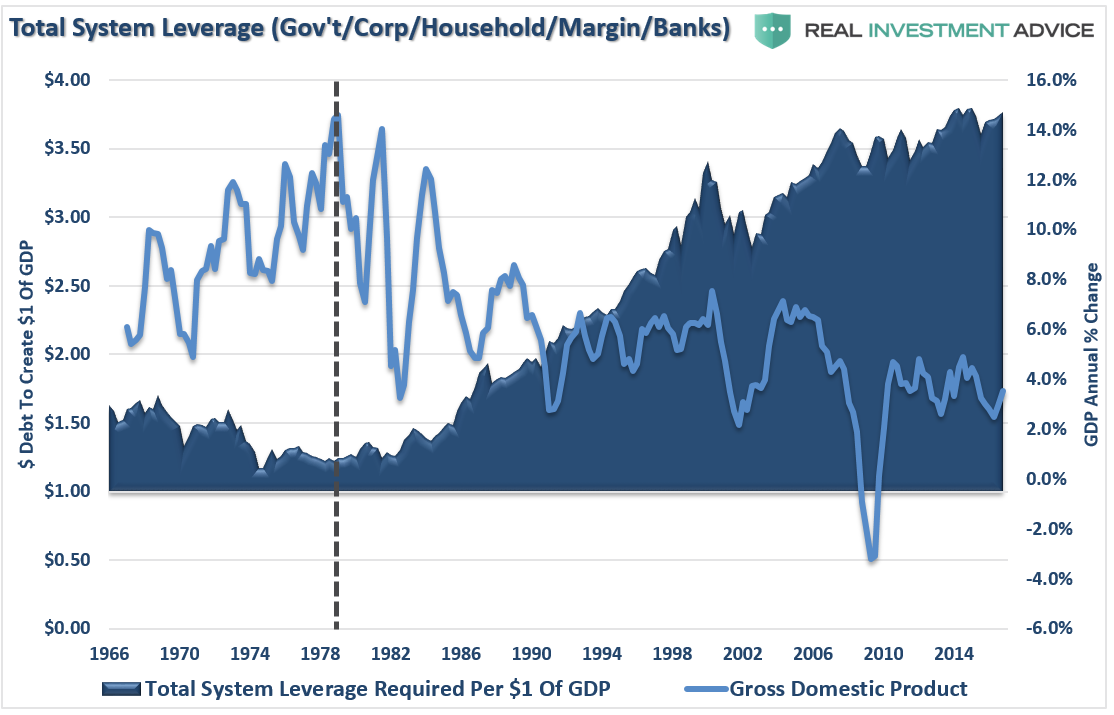
At nearly $4.00 of debt for each $1 of economic growth, there is little ability to spur higher rates of economic growth when productive investments are diverted by rising levels of debt service.
But to understand the problem, let’s look at the state of the middle class.
Why Giving The Middle-Class A Tax Cut May Not Work?
Just recently Motley Fool took a look at consumer debt:
“The average American household has total debt of more than $90,000, which includes households that live debt free. The average household with debt owes more than $130,000.
This debt burden is costing the average household more than $6,600 in interest per year — about 9% of the average income.
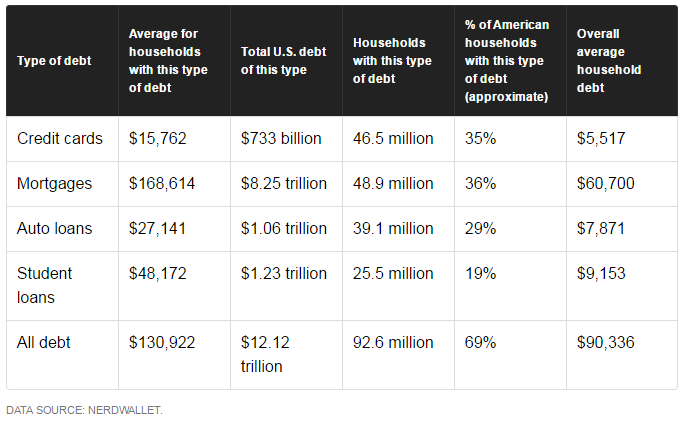
According to NerdWallet’s 2015 American Household Credit Card Debt Study, the average U.S household with debt owes $130,922 — including credit cards, mortgages, auto loans, student loans, and other forms of debt. Here’s a breakdown of the debts of the average American household as of the fourth quarter of 2015.”
As I noted above, Nerd Wallet also noted the same:
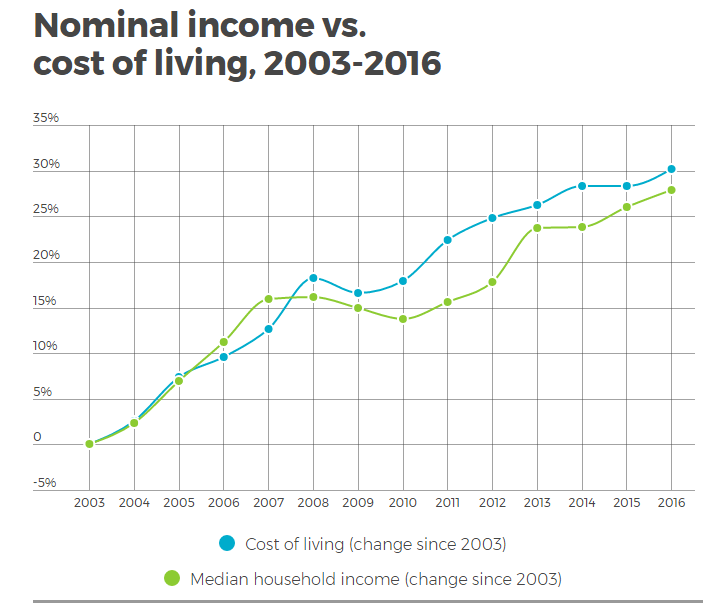
“Household income has grown by 28% in the past 13 years, but the cost of living has gone up 30% in that time period. Some of the largest expenses for consumers — like medical care, food, and housing — have significantly outpaced income growth.
Many people assume that credit card debt is the result of reckless spending and think that to get out of debt, people need to stop buying designer clothes and eating at five-star restaurants. But many people use credit cards to cover necessities when their income just doesn’t cut it.”
This explains why, according to CNN, almost six out of every ten Americans do not have enough money saved to even cover a $500 emergency expense.
Okay, you get the point. Roughly 80% of Americans are living paycheck-to-paycheck and are carrying enough debt that interest payments consume a bulk of actual disposable income.
So, here is the issue of tax cuts for the middle class. The ch!art below shows “who pays what in Federal taxes.”
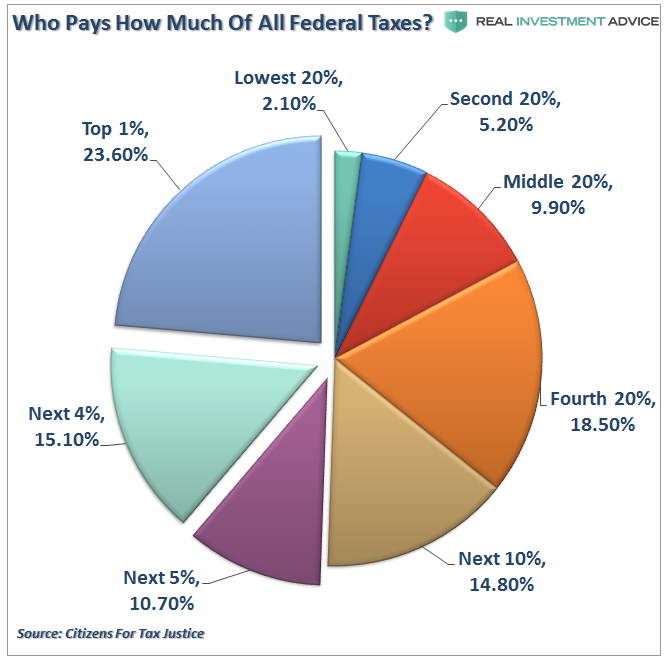
You will note that roughly 50% of ALL taxes paid are paid by the Top 10% of income earners. The other 50% of all taxes are paid by remaining 90% of which, according to recent studies, 67% have less than $500 in savings. In fact, the bottom 80% only pays 36% of all tax revenue collected.
Of course, those in the top 20-30% of income earners are likely already consuming at a level with which they are satisfied. Therefore, a tax cut which delivers a few extra dollars to their bottom line, will likely have a negligible impact on their current levels of consumption.
However, for the bottom 70% of the income earners, any tax relief will most likely evaporate into the maintaining the current cost of living and debt service and will have an extremely limited, if any, impact on fostering a higher level of consumption in the economy.
The current problem facing the economy, and the Administration in its quest to create economic growth, remains the overwhelming debt burden that currently exists. While Reagan received the benefit from the deregulation of banks which allowed for the debt-driven expansion of the economy, unfortunately, Trump is faced without such a tailwind.
As Dr. Lacy Hunt recently noted in his quarterly outlook:
“Considering the current public and private debt overhang, tax reductions are not likely to be as successful as the much larger tax cuts were for Presidents Ronald Reagan and George W. Bush. Gross federal debt now stands at 105.5% of GDP, compared with 31.7% and 57.0%, respectively, when the 1981 and 2002 tax laws were implemented. Additionally, tax reductions work slowly, with only 50% of the impact registering within a year and a half after the tax changes are enacted. Thus, while the economy is waiting for increased revenues from faster growth from the tax cuts, surging federal debt is likely to continue to drive U.S. aggregate indebtedness higher, further restraining economic growth.
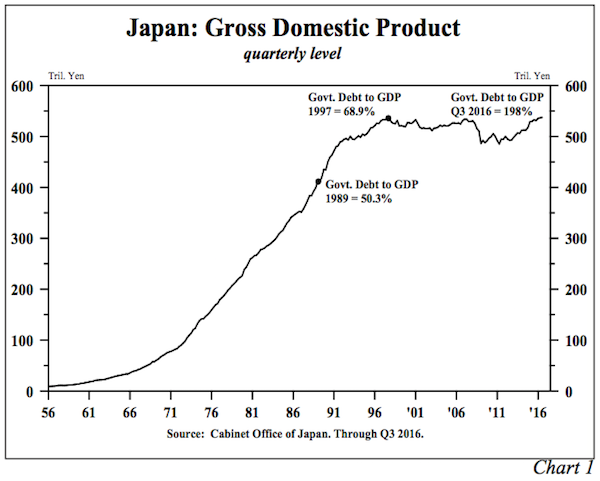
However, if the household and corporate tax reductions and infrastructure tax credits proposed are not financed by other budget offsets, history suggests they will be met with little or no success. The test case is Japan. In implementing tax cuts and massive infrastructure spending, Japanese government debt exploded from 68.9% of GDP in 1997 to 198.0% in the third quarter of 2016. Over that period nominal GDP in Japan has remained roughly unchanged. Additionally, when Japan began these debt experiments, the global economy was far stronger than it is currently, thus Japan was supported by external conditions to a far greater degree than the U.S. would be in present circumstances.”
The U.S. faces similar problems as Japan with about an 11-year lag which has now come home to roost. From demographics to debt, incomes to economic growth, the similarities are all far to deep to dismiss.
As Dr. Hunt concludes the consumption driven dynamic of economic growth, which is currently being bet on by the market for a continued rise in profitability, is likely to remain extraordinarily weak. To wit:
“Over time, birth, immigration, and household formation decisions have been heavily influenced by real per capita income growth. Demographics have, in turn, cycled back to influence economic growth. If they are both rising, a virtuous long-term cycle will emerge. Today, however, a negative spiral is in control. In the ten years ending in 2016, real per capita disposable income rose a mere 1%, less than half of the 50-year average and only one-quarter of the growth of the 3.9% peak reached in 1973. In view of the enlarging debt overhang, which is the cause of these mutually linked developments, economic growth should continue to disappoint. There will likely be intermittent spurts in economic activity, but they will not be sustainable.”
We are clearly in a late stage expansion and, as I discussed recently, the pent-up demand for big-ticket items, like autos, has been exhausted.
“Economic cycles do not last indefinitely. While fiscal and monetary policies can extend cycles by “pulling forward” future consumption, such actions create an eventual “void” that cannot be filled. In fact, there is mounting evidence the “event horizon” may have been reached as seen through the lens of auto sales.
Following the financial crisis, the average age of vehicles on the road had gotten fairly extended so a replacement cycle became more likely. This replacement cycle was accelerated when the Obama Administration launched the “cash for clunkers” program which reduced the number of “used” vehicles for sale pushing individuals into new cars. Combine replacement needs with low interest rates, easy financing, and extended terms and you get a sales cycle as shown below.”
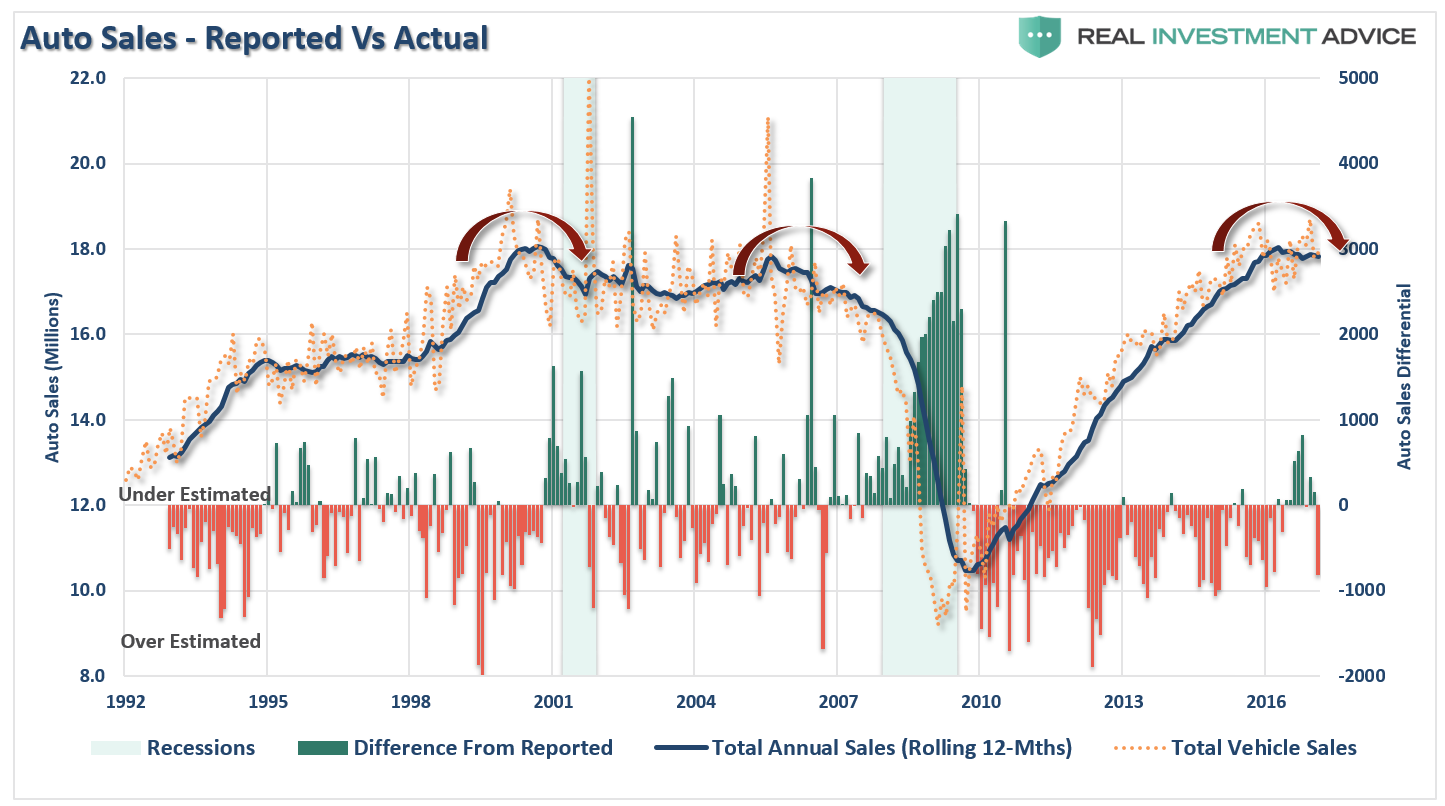
(Note: When auto sales are reported each month they are annualized. The bar chart shows the over/underestimation of auto sales each month as compared to what actually occurred on an annual basis.)
With the current expansion now in its 83rd month, it is more than 20 months longer than the average since the end of World War II. Pent-up demand has been exhausted, and the future demand void created by the Fed’s monetary interventionism the economy is in the opposite condition of what is found during a recession or an early stage expansion. The waning of demand, which made a visible presence in Apple’s Q1 iPhone sales, makes the economy susceptible to either slower growth or to the risk of an outright recession.
In fact, just like in 2008, debts are going bad at a very alarming pace. In fact, things have already gotten so bad the IMF has issued a major warning about it…
“In America alone, bad debt held by companies could reach $4 trillion, or almost a quarter of corporate assets considered. That debt could undermine financial stability if mishandled.
The percentage of ‘weak,’ ‘vulnerable’ or ‘challenged’ debt held as assets by US firms has almost arrived at the same level it was right before the 2008 crisis.”
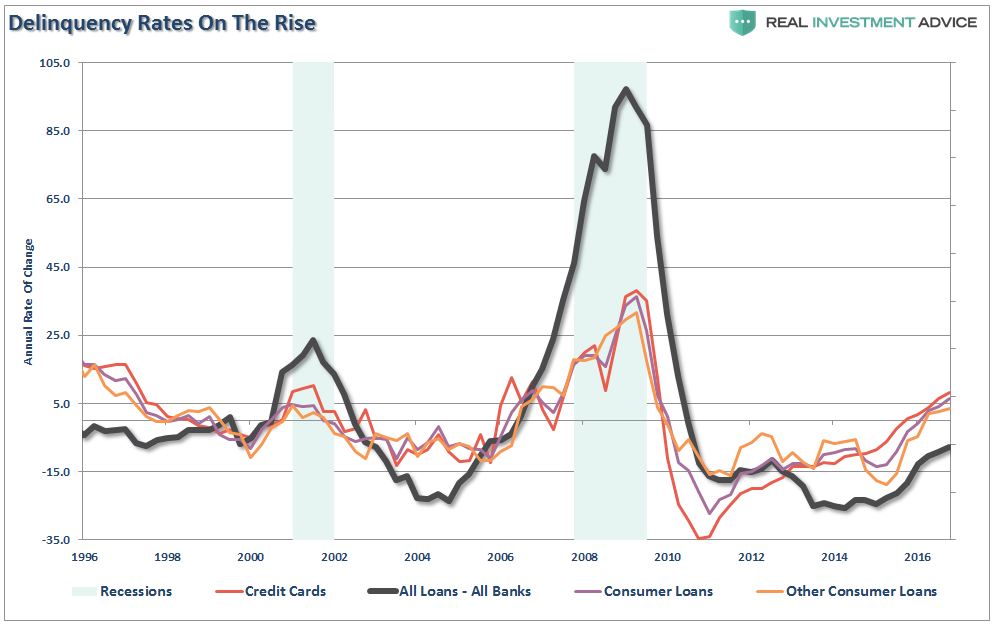
Such can be clearly witnessed by low productivity, weakness in auto sales and most discretionary goods, and the rising delinquency rates, and fall in demand, across major loan types.
The impact of tax cuts, both at the corporate and personal levels, is likely far less impactful than the markets are currently expecting. This keeps the risk of disappointment very high.
“At this stage of the cycle, setting new records is a reason for caution, not optimism.” – Dr. Lacy Hunt
Lance Roberts is a chief portfolio strategist and economist for Clarity Financial.
© 2024 Newsmax Finance. All rights reserved.